

Profiling
The span waterfall tells you which operation was slow. The flame graph tells you which function.
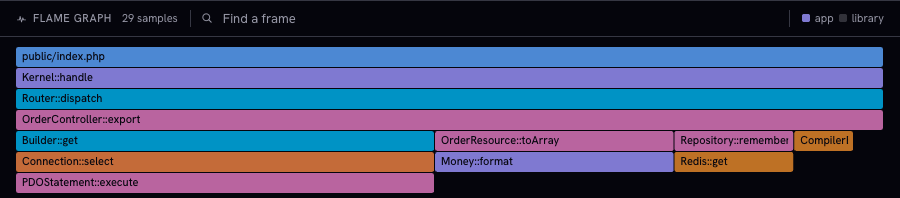
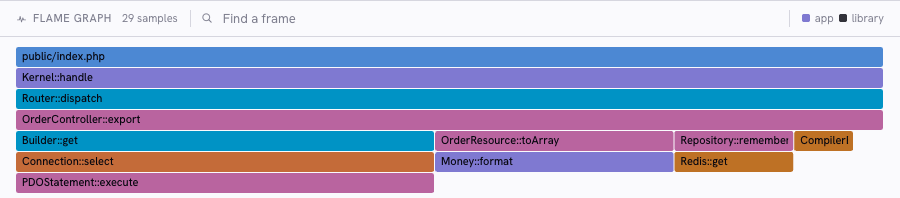
Tindra samples nothing itself. Your SDK's profiler captures the call stack a hundred times a second while a transaction runs, ships the samples alongside the transaction, and Tindra folds them into a flame graph on the transaction detail page.
Find a profile during an investigation
Use shared filters to find the relevant transaction, or select an application user to inspect their individual traces. A stored profile belongs to its captured transaction and time; opening it preserves the surrounding investigation context. A matching trace only has a flame graph if profiling was enabled and a profile was captured and retained.
Requirements
Profiling hangs off tracing. If traces_sample_rate is 0, there are no transactions, so there is nothing to profile. Set that first, then turn on the profiler.
Nothing needs enabling on the Tindra side. Profiles are accepted as soon as your SDK sends them, on every project, unless someone has turned the project's switch off.
Two ways SDKs profile
Sentry SDKs ship profiling data in two formats and Tindra accepts both.
| Mode | How it works | Cap |
|---|---|---|
| Transaction profiling | One profile per transaction. Starts when the transaction starts, stops when it ends. | 30 seconds |
| Continuous profiling | The profiler runs on its own and ships chunks. Tindra cuts out the slice that overlaps each transaction. | 66 seconds per chunk |
Which one you get depends on the SDK and its version. Newer SDKs default to continuous. You do not have to care which is which: the flame graph looks the same either way.
Enabling it
Laravel
Needs the Excimer extension. Linux and macOS only, no Windows build.
apt-get install php-excimer # or: pecl install excimer
SENTRY_TRACES_SAMPLE_RATE=0.1
SENTRY_PROFILES_SAMPLE_RATE=1.0
profiles_sample_rate is relative to traces_sample_rate. The pair above traces 10% of requests and profiles all of those, so 10% of requests end up with a flame graph. Requires sentry/sentry-laravel 3.3.0 or newer.
PHP
\Sentry\init([
    'dsn' => 'https://your-key@your-hostname.tindra.sh/1',
    'traces_sample_rate' => 0.1,
    'profiles_sample_rate' => 1.0,
]);
Same Excimer requirement. Requires sentry/sentry 3.15.0 or newer.
Python
Transaction profiling, from SDK 1.18.0:
sentry_sdk.init(
    dsn="https://your-key@your-hostname.tindra.sh/1",
    traces_sample_rate=0.1,
    profiles_sample_rate=1.0,
)
Continuous profiling, from SDK 2.24.1:
sentry_sdk.init(
    dsn="https://your-key@your-hostname.tindra.sh/1",
    traces_sample_rate=0.1,
    profile_session_sample_rate=1.0,
    profile_lifecycle="trace",
)
profile_lifecycle="trace" runs the profiler whenever a span is active, which is what you want for a web app. Use "manual" plus sentry_sdk.profiler.start_profiler() / stop_profiler() if you want to profile a specific block of work instead.
Node.js
npm install @sentry/profiling-node
The @sentry/profiling-node version must match your @sentry/node version exactly.
const Sentry = require('@sentry/node');
const { nodeProfilingIntegration } = require('@sentry/profiling-node');

Sentry.init({
  dsn: 'https://your-key@your-hostname.tindra.sh/1',
  integrations: [nodeProfilingIntegration()],
  tracesSampleRate: 0.1,
  profileSessionSampleRate: 1.0,
  profileLifecycle: 'trace',
});
Browser JavaScript
Browser profiling uses the JS Self-Profiling API, which only exists in Chromium browsers. Chrome and Edge users get profiles, everyone else does not.
Your server must send a Document-Policy: js-profiling response header on the HTML document, or the browser refuses to start the profiler.
Sentry.init({
  dsn: 'https://your-key@your-hostname.tindra.sh/1',
  integrations: [
    Sentry.browserTracingIntegration(),
    Sentry.browserProfilingIntegration(),
  ],
  tracesSampleRate: 0.1,
  profileSessionSampleRate: 1.0,
});
Ruby
Add a profiler gem. stackprof works everywhere; vernier handles multi-threaded servers like Puma better and needs Ruby 3.2.1+.
gem 'stackprof' # or: gem 'vernier'
Sentry.init do |config|
  config.dsn = 'https://your-key@your-hostname.tindra.sh/1'
  config.traces_sample_rate = 0.1
  config.profiles_sample_rate = 1.0
  # Vernier only:
  # config.profiler_class = Sentry::Vernier::Profiler
end
stackprof needs sentry-ruby 5.9.0, vernier needs 5.21.0.
Go
The Sentry Go SDK has no profiler, so there is nothing to enable. Everything else in the Go guide works normally.
Reading the flame graph
The graph is an icicle: the entry point is the top bar, callees stack downward. Width is the share of samples a frame appeared in, so a wide bar means "a lot of time went through here", not "this function is slow".
Every frame carries two numbers:
- Self: samples where this frame was the one running. This is what "this function is slow" means.
- Total: samples where this frame was anywhere on the stack. This is what "this call path is slow" means.
A frame with a large total and a tiny self is a router, a middleware stack, or a framework entry point. Keep descending until self time shows up.
Getting around
| Action | What it does |
|---|---|
| Hover a frame | Tooltip with self and total samples, milliseconds, and percentage |
| Click a frame | Zoom so that frame fills the width |
Breadcrumb / Esc |
Walk back up one zoom level |
| Type in Find a frame | Dims everything that does not match, so hits keep their surrounding stack |
App frames and library frames get different colors, and the toolbar shows a legend for both.
Milliseconds are derived from the measured gap between samples, not from the SDK's nominal sample rate, so they stay honest when the profiler drifts. When there are too few samples to measure that gap the toolbar shows no timings and only sample counts are displayed.
Idle samples
Samples where the thread had an empty stack are counted as idle and reported separately in the toolbar. They are not attributed to any frame, so a request that spent 80% of its time waiting on the database will have far fewer flame graph samples than you expect. That is correct: the profiler only sees your process, and blocking on a socket is not your process running. The span waterfall is the right tool for that time.
Threads
The graph shows one thread: the one the transaction actually ran on. Transaction profiles name their active thread; continuous profiles are matched on the thread id the transaction recorded. Background threads and worker pools are not folded in.
Turning it off for one project
The storage budget below is instance-wide and the oldest profiles are deleted first across every project, so one busy service profiling continuously can crowd out the rest.
To stop accepting profiles from a project, open Settings > Projects, edit the project, and uncheck Accept profiles from this project. Errors, transactions and everything else from that project keep flowing. Only profiles are dropped, at ingest, before anything is written.
The same switch is on the API:
curl -X PATCH https://your-hostname.tindra.sh/api/projects/{id} \
  -H 'Authorization: Bearer your-api-token' \
  -H 'Content-Type: application/json' \
  -d '{"name":"api-server","slug":"api-server","profiling_enabled":false}'
name and slug are required on this endpoint, and the caller needs the manage_projects permission, so a read-only API token will not do. Leave profiling_enabled out entirely and the current setting is kept, so an older client cannot turn profiling off by renaming a project.
Profiles already stored are not deleted when you flip the switch. They age out on the schedule below.
Retention and storage
Profiles are much larger per second of runtime than anything else Tindra stores, so they do not follow RETENTION_DAYS. They get their own window and their own byte budget.
| Variable | Default | Description |
|---|---|---|
PROFILE_RETENTION_DAYS |
7 |
Days to keep profiles. 0 keeps forever, subject to the storage limit. |
PROFILE_STORAGE_LIMIT_MB |
2048 |
Instance-wide profile storage budget. Oldest profiles are deleted first once it is exceeded. 0 is unlimited. |
PROFILE_BUFFER_SIZE |
500 |
Compressed profiles queued in memory; pending profiles also have a fixed 128 MiB byte cap. |
Both cleanup policies run in bounded batches at startup and normally hourly, with five-minute catch-up cycles when deletion budgets are exhausted. They remain active even when RETENTION_DAYS=0; disable both profile limits with 0 to disable profile cleanup entirely.
Profiles are zstd-compressed before they hit the database. The storage limit counts compressed bytes, and so does the per-project storage figure in Settings > Projects.
The storage budget triggers oldest-first cleanup rather than rejecting each new profile at an exact disk ceiling. Usage can temporarily exceed it between passes. For longer history, size both the budget and retention window for your workload.
The memory queue is separate from this storage budget. It is best effort and cannot survive a process crash; increasing PROFILE_BUFFER_SIZE does not increase retained history.
On managed plans the budget and window are set for you and scale with the plan: 256 MB for 7 days on Hobby, 1 GB for 7 days on Indie, 4 GB for 14 days on Studio, 8 GB for 14 days on Scale. See the Billing FAQ.
Profiles do not count as events
Your monthly event count is errors plus transactions. Profiles are not counted, on managed plans or self-hosted. Turning profiling on will not move you into a larger plan. It will use disk, which is what the storage budget is for.
Privacy
Frame metadata goes through the same scrubbing patterns as everything else: absolute paths, filenames, function names, and module names are all run through your project's PII scrubbing rules before storage. Absolute paths in particular tend to carry a developer's home directory or a deploy path.
The sample and stack arrays are plain integers and carry nothing to scrub.
Limits
| Limit | Value |
|---|---|
| Transaction profile duration | 30s |
| Continuous chunk duration | 66s |
| Samples per profile | 200,000 |
| Envelope size | 20 MB |
These match what upstream Relay enforces, so an SDK that works against Sentry works against Tindra.
A profile that breaks one of these limits is dropped on its own. The transaction it travelled with is still stored, and you still get the span waterfall. An envelope larger than 20 MB is rejected with a 413.
What is not supported
- Symbolication. PHP, Python, Ruby, Node, and browser JavaScript send symbolicated frames and read fine. Native platforms (iOS, macOS, Android NDK) send raw instruction addresses, and Tindra does not resolve them against debug files. You will see addresses, not function names.
- Aggregate flame graphs. Profiles are per transaction. There is no merged view across every request to an endpoint yet.
- Standalone profile browsing. Continuous profiling chunks are only reachable through the transactions they overlap.
Troubleshooting
No flame graph on the transaction detail page. No matching retained profile is available for that transaction. Open Project Setup to distinguish disabled profiling, queued data, confirmed storage, and recent rejections. Work down the list: is Accept profiles from this project still checked in Settings > Projects, is traces_sample_rate above 0, is the profile sample rate above 0, is the profiler extension actually installed (php -m | grep -i excimer for PHP), and did the transaction take long enough to collect samples? A 5ms request at 101 Hz collects zero or one sample.
Setup says a profile was received, but offers no transaction link. The setup panel looks for a matching profile among the 100 most recently received transactions. No match in that sample does not mean no profile was stored. Check transaction sampling, profile identifiers, and retention, or open the relevant transaction directly. A retained setup milestone can also outlive the underlying profile.
It worked yesterday and not today. Check PROFILE_RETENTION_DAYS and PROFILE_STORAGE_LIMIT_MB. Profiles age out much faster than transactions by design, so an old transaction keeps its waterfall long after its profile is gone.
Everything is <unknown> or hex addresses. That is an unsymbolicated native profile. See above.
Next steps
- Transactions: the span waterfall the flame graph sits under
- N+1 Detection: repeated queries, found automatically
- Configuration: every environment variable