Log Viewer
Tindra captures structured log entries from your applications alongside errors and transactions. Logs are searchable, filterable, and correlated to traces so you can follow a request from the log line that fired to the transaction it happened in.
Enabling log capture
Log capture requires SDK support for the Sentry logs API. The JavaScript, Node.js, and Python SDKs support this today. For other languages, check your SDK changelog for logs or structured logging support.
JavaScript / Node.js
import * as Sentry from '@sentry/browser'; // or @sentry/node

Sentry.init({
  dsn: 'https://your-key@acme.tindra.sh/1',
});

// console.log/warn/error are captured automatically
// Or use the Sentry logger for structured output:
Sentry.logger.info('User signed in', { userId: user.id });
Sentry.logger.warn('Quota approaching limit', { usage: 0.9 });
Sentry.logger.error('Payment failed', { orderId: order.id });
Python
import sentry_sdk

sentry_sdk.init(dsn="https://your-key@acme.tindra.sh/1")

import logging
logging.basicConfig(level=logging.INFO)
logger = logging.getLogger(__name__)

logger.info("User signed in", extra={"user_id": user_id})
logger.error("Payment failed", extra={"order_id": order_id})
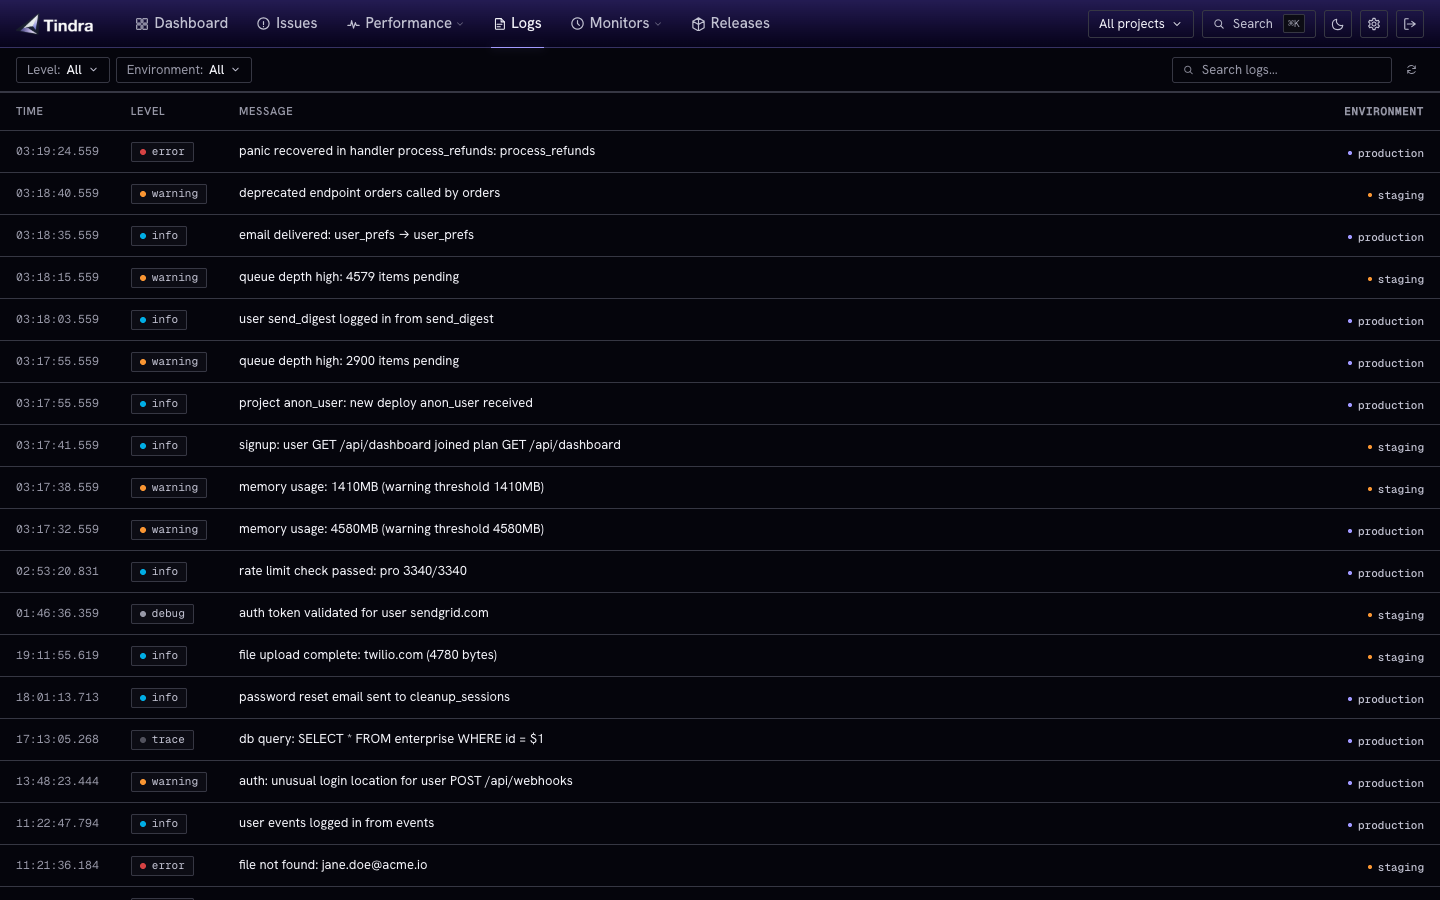
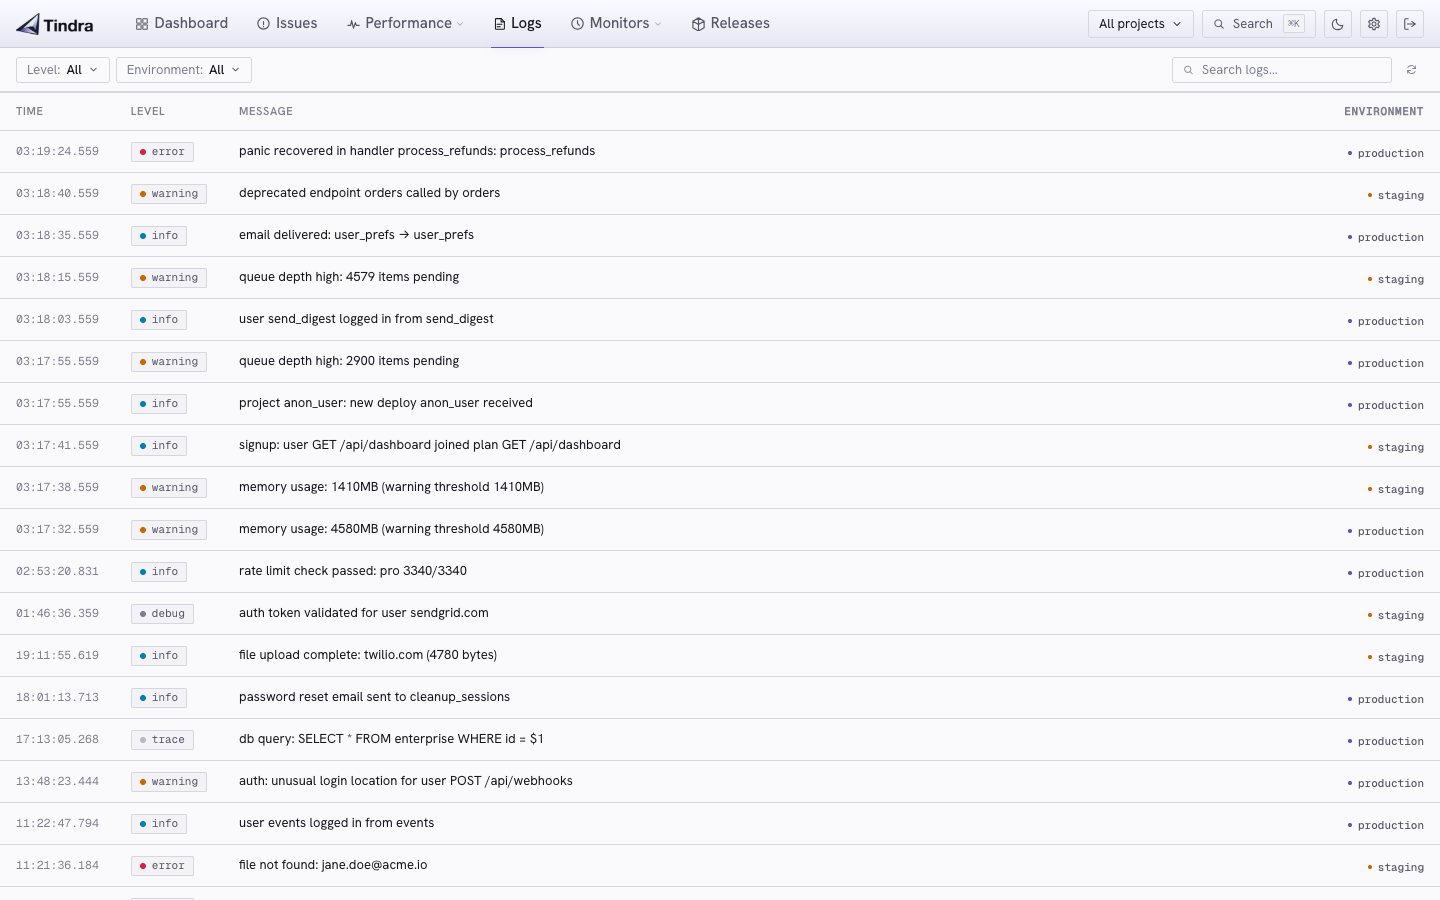
Viewing logs
Navigate to Logs in the sidebar. Each row shows:
- Timestamp: when Tindra received the entry
- Level: trace, debug, info, warning, error, or fatal
- Message: the log body
- Environment: the environment tag from the SDK
Click any row to expand it and inspect the full structured payload: all key-value attributes, trace ID, span ID, release tag, and any custom data attached to the entry.
Filtering
| Filter | How to use |
|---|---|
| Level | Show entries at or above a severity (e.g., warning and above) |
| Environment | Scope to production, staging, or any environment tag |
| Search | Full-text search across log messages and attributes |
| Project | Filter to one or more projects using the project selector |
The viewer updates automatically as new logs arrive.
Trace correlation
Log entries that carry a trace_id are linked to their parent transaction. If tracing is enabled in your SDK, any log captured during a traced request will include the trace ID automatically. Click the trace link in the expanded row to jump directly to the transaction span waterfall.
This makes it easy to answer "what was the app logging during that slow request?" without switching tools.
Retention
Log entries follow the same retention policy as events, configured by RETENTION_DAYS. Older entries are pruned automatically. See Configuration for details.