Email
SMTP, Postmark, Brevo, Ahasend, Lettermint, Cloudflare
Error tracking, performance monitoring, and cron job health in a single Go binary backed by Postgres. No microservices, no proprietary storage engines, no ops complexity. This page covers what the product actually does.
The dashboard is the first thing you see when you open Tindra. It aggregates signal from every project into a single live view so you know the health of your entire stack at a glance.
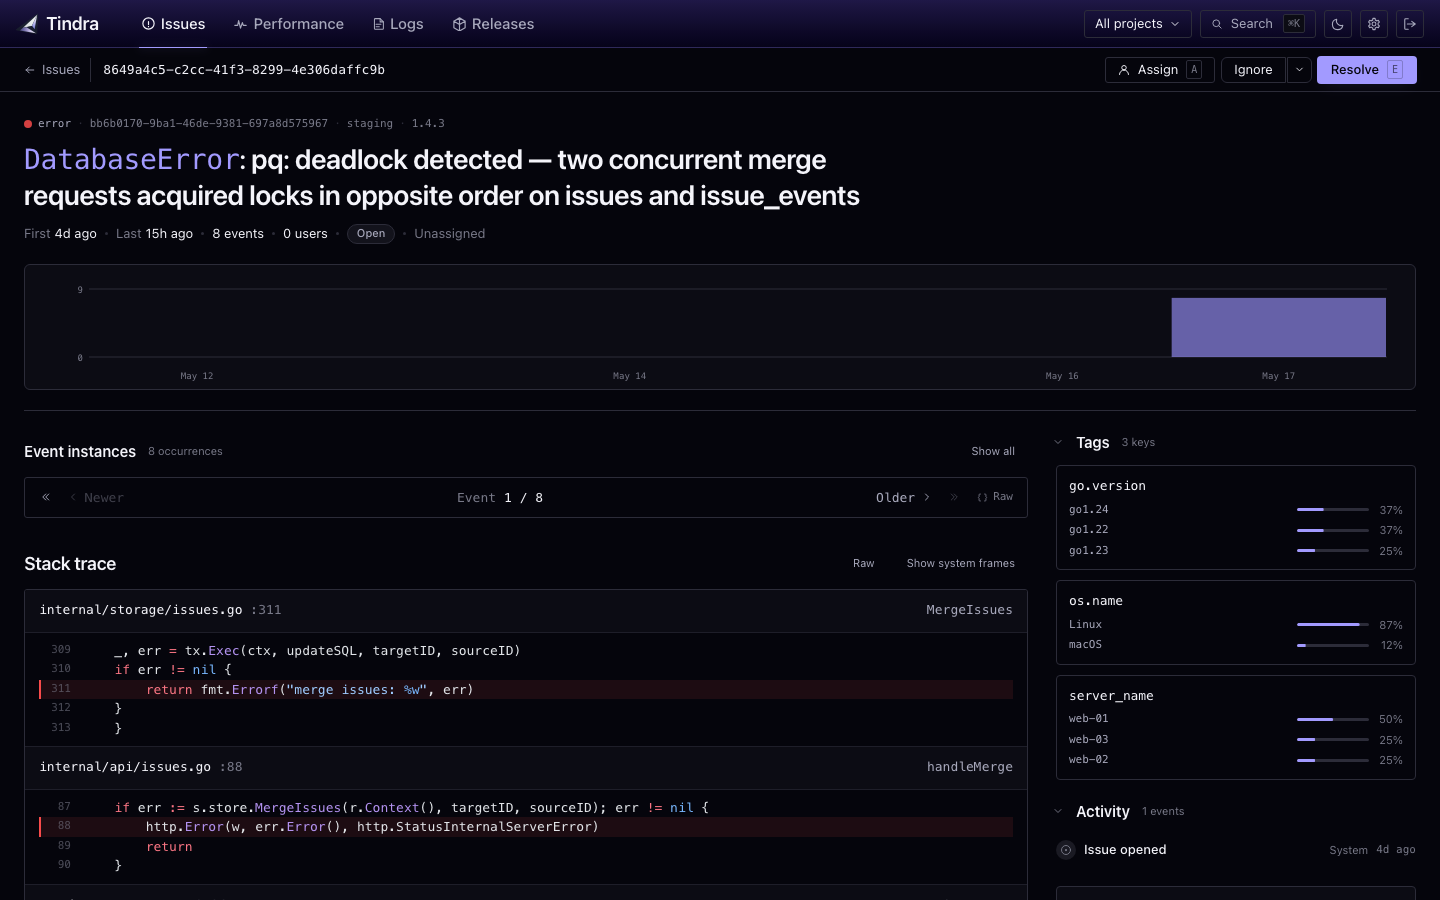
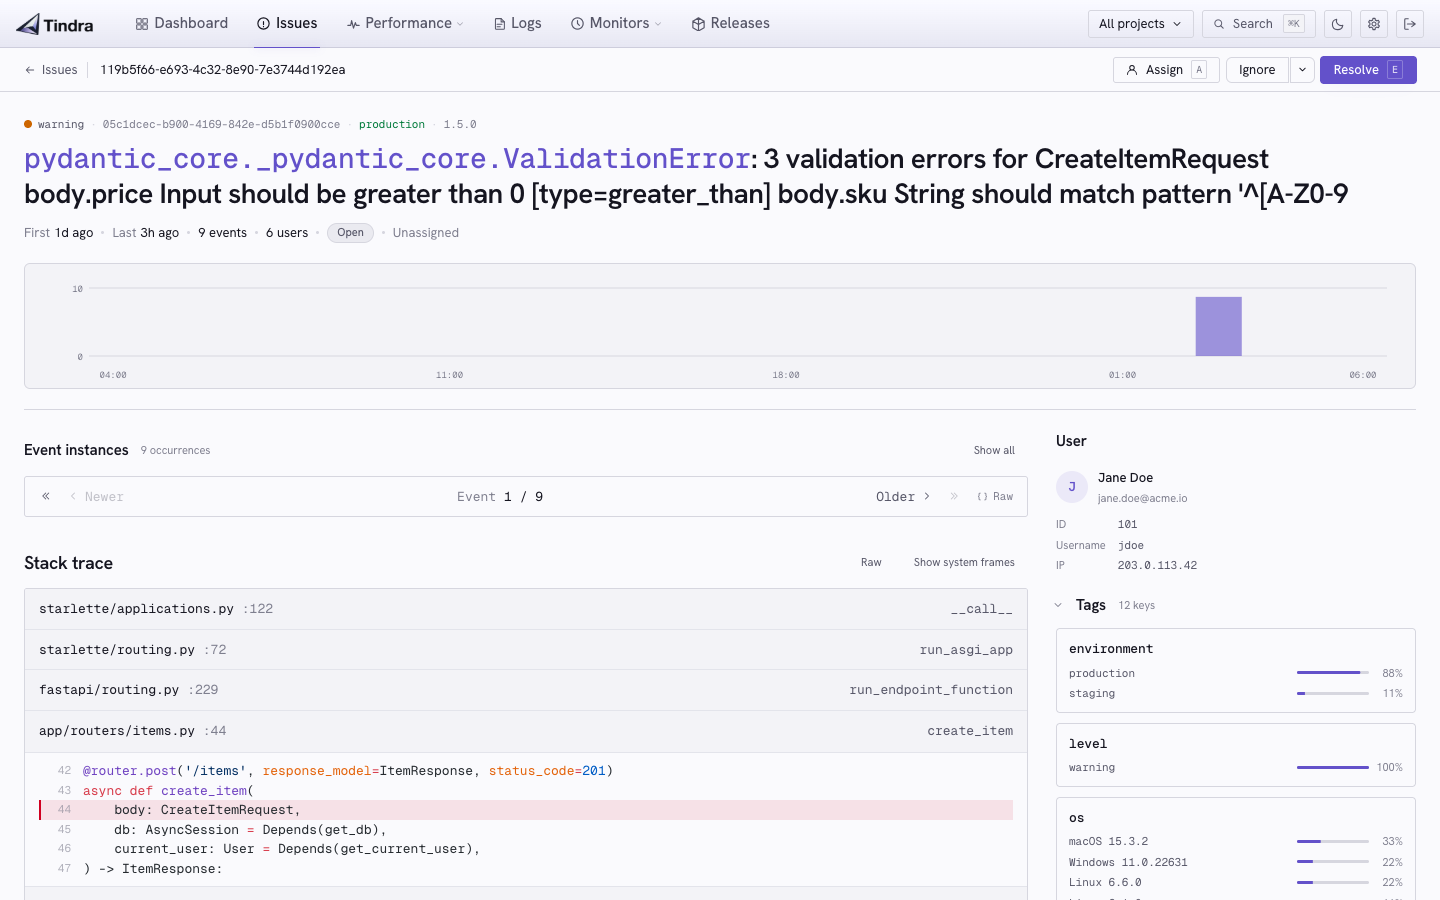
Every unhandled exception, every caught error you forward, lands in the issue list grouped by fingerprint. Tindra deduplicates intelligently so your team works on unique problems, not thousands of identical notifications.
Each issue carries the full stack trace, a breadcrumb timeline of what led to the crash (HTTP requests, DB queries, log lines, user actions), the environment it occurred in, and the raw event payload.
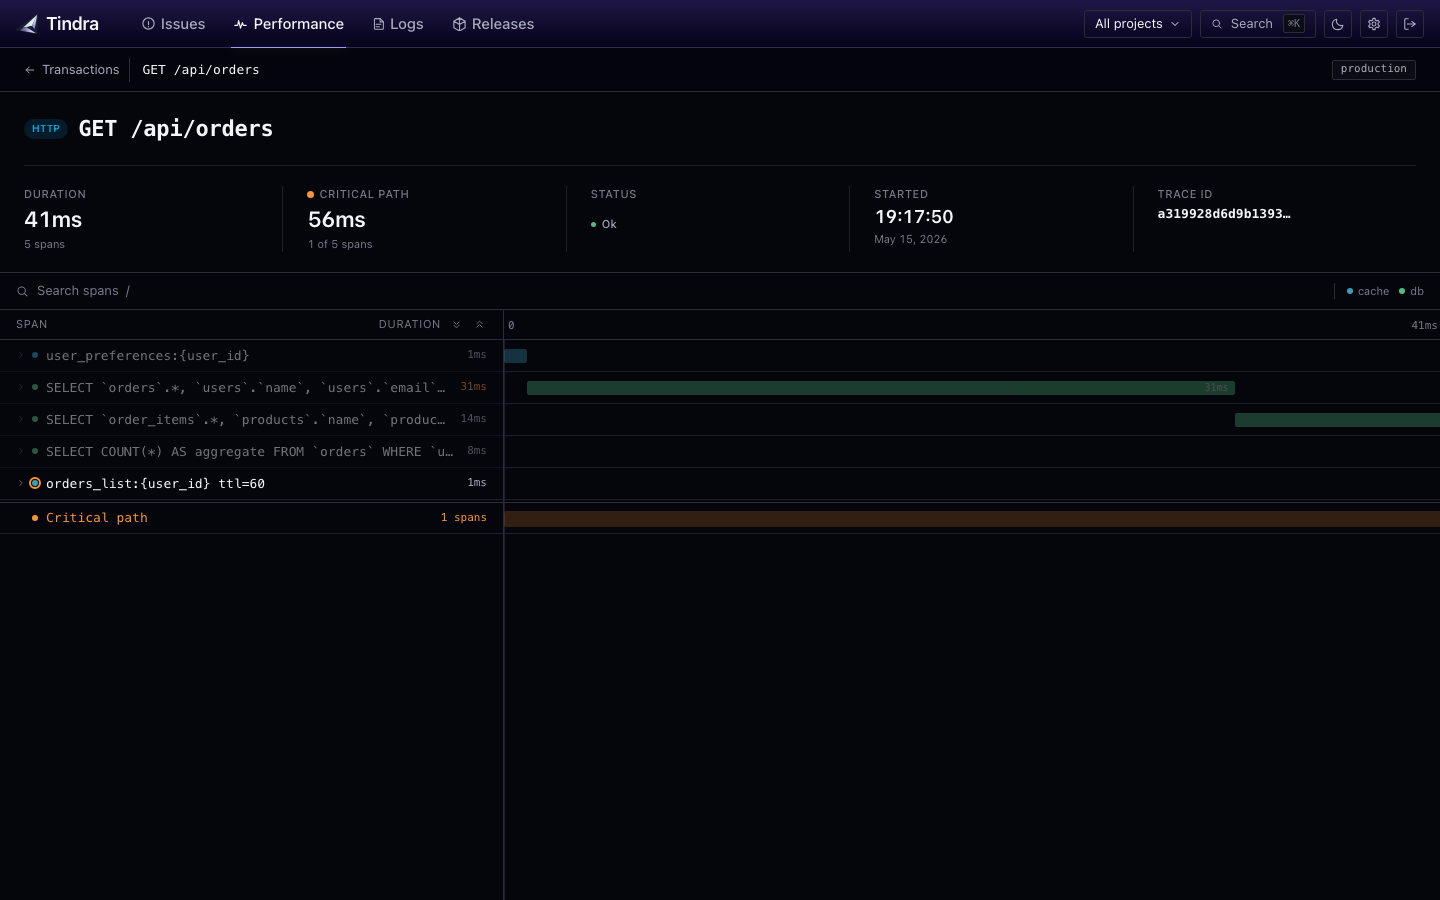
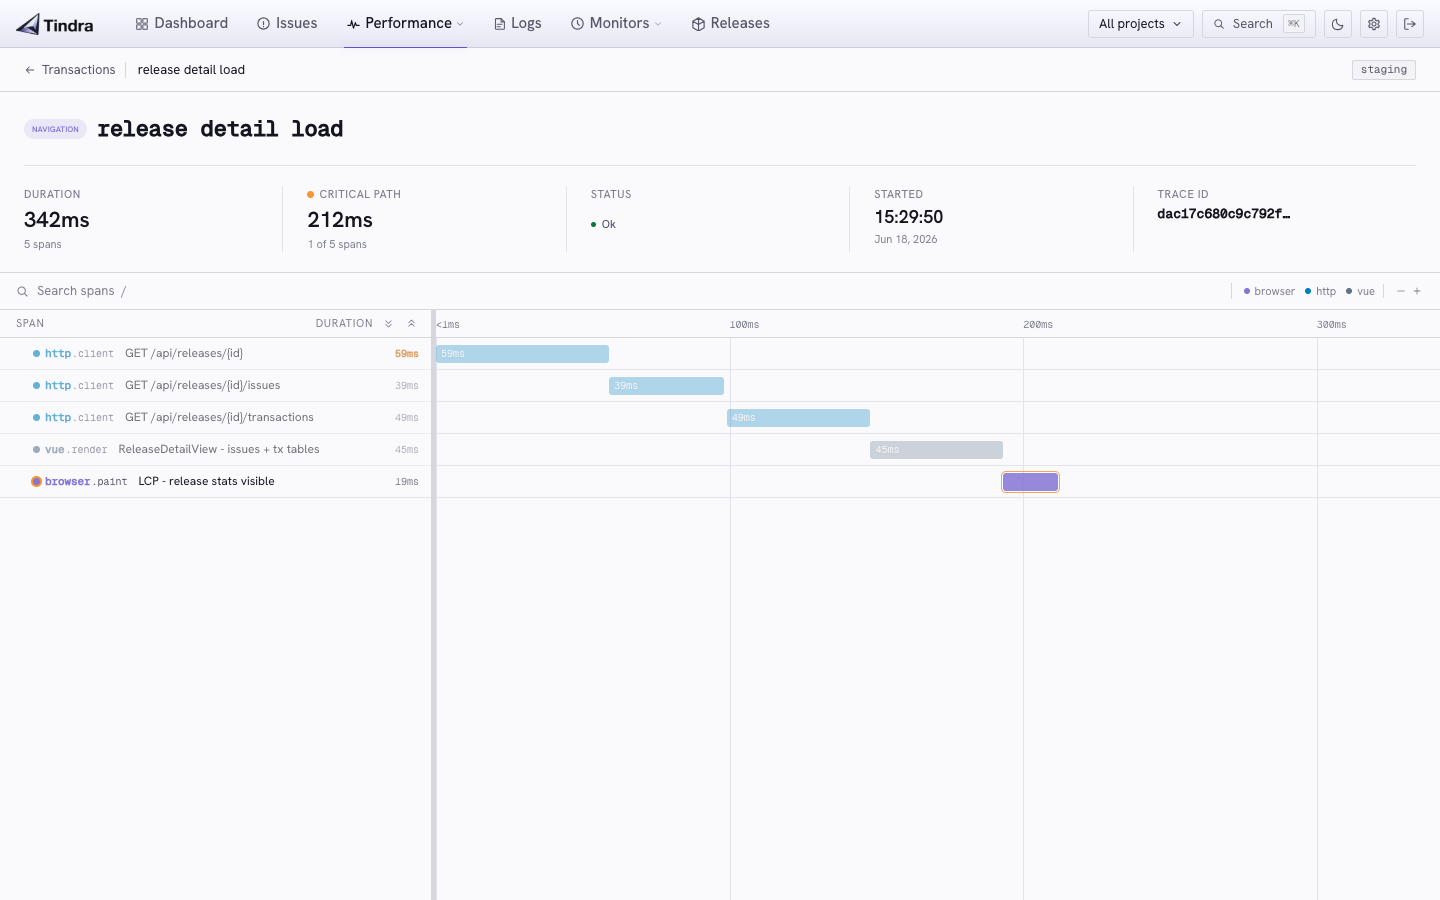
Every traced request becomes a transaction with a full span waterfall: database queries, HTTP calls to external services, template renders, queue dispatches. See exactly where your 800ms went.
Tindra tracks releases automatically from the SDK's release tag. No manual setup. After a deploy, you can filter the issue list and transaction list to that release and immediately see what changed.
If something that was resolved in v1.4.2 reappears in v1.4.3, Tindra marks it regressed and surfaces it. Useful for catching the inevitable "fixed it in staging, broke it in prod."
Tindra monitors two things: scheduled jobs that should run on a cron schedule, and HTTP/HTTPS endpoints that should always be up. Both feed into the same alert rules and notification channels.
Cron monitors
Uptime monitors
Tindra sends alerts on conditions that matter: a new issue, a regression, an error rate spike, or a cron job that stopped running. Not a flood of identical notifications for each occurrence.
{
  "rule_name": "High error rate",
  "trigger": "new_issue",
  "project_name": "my-app",
  "fired_at": "2024-11-15T14:32:00Z",
  "issues": [{ "title": "TypeError: …" }]
}
Tindra implements the Sentry event ingest protocol. Any SDK that can send to Sentry can send to Tindra. Update the DSN in your config, deploy, done. No SDK changes, no adapter libraries, no rewriting instrumentation.
If you want a zero-risk migration, use the passthrough DSN: configure Tindra to forward every incoming event to a second endpoint while also processing it locally. Run both in parallel until you're confident, then cut the old one.
Tindra ships with the access controls a real team needs. OIDC-based SSO works with any standards-compliant provider. TOTP MFA is built in. Roles keep people out of things they shouldn't touch.
REQUIRE_MFA=false
Tindra ships a built-in MCP server on POST /mcp. Connect Claude,
Cursor, Windsurf, or any MCP-compatible tool and ask about open issues, slow
endpoints, cron health, and recent logs without leaving the tool you're already in.
Authenticate with a per-project API token. Write access is opt-in: read-only tokens work everywhere, writable tokens unlock mutations.
{
  "tindra": {
    "command": "npx",
    "args": ["mcp-remote", "https://acme.tindra.sh/mcp"]
  }
}
PII scrubbing runs at ingest time. Data matching a rule never reaches storage. No scheduled cleanup job, no purge queue. If it matches, it never lands.
Field name scrubbing replaces any value whose key matches a pattern (password, token, api_key, credit_card, and more). Pattern scrubbing scans every string value with a regex. Both run on every event, recursively through nested objects.
The entire Tindra server is a single statically-compiled Go binary. Connect it to a Postgres database and you have the full stack. No sidecar processes, no object storage, no message broker.
Managed instances are dedicated per customer: your own container, your own Postgres, hosted in the EU. Upgrades, backups, and the pager are on us.
| Language | Go (single static binary) |
|---|---|
| Storage | Postgres 12+ |
| RAM (minimum) | 512 MB |
| Config | Environment variables |
| Upgrades | Pull new image, restart |
| License | Elastic License v3 (ELv3) |
Pull the Docker image and you are running in minutes. Or start a managed trial and have your own instance ready before your coffee is done.