

Alert Rules
Alert rules notify you when errors spike, a new issue appears, log volume crosses a threshold, or a monitor goes down. Get notified via email, Slack, Discord, Microsoft Teams, or a webhook.
Creating a rule
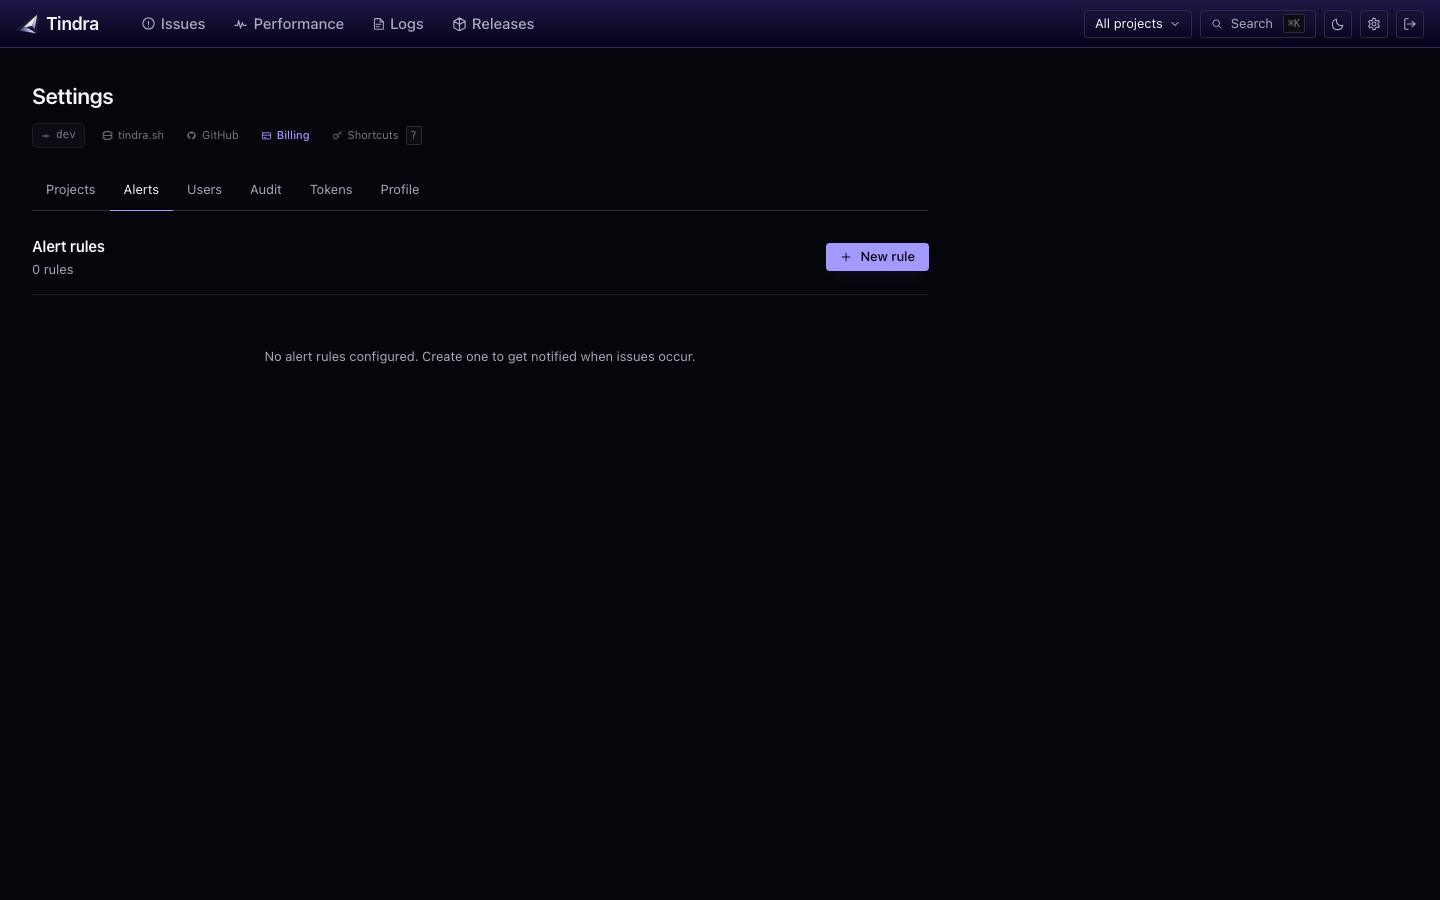
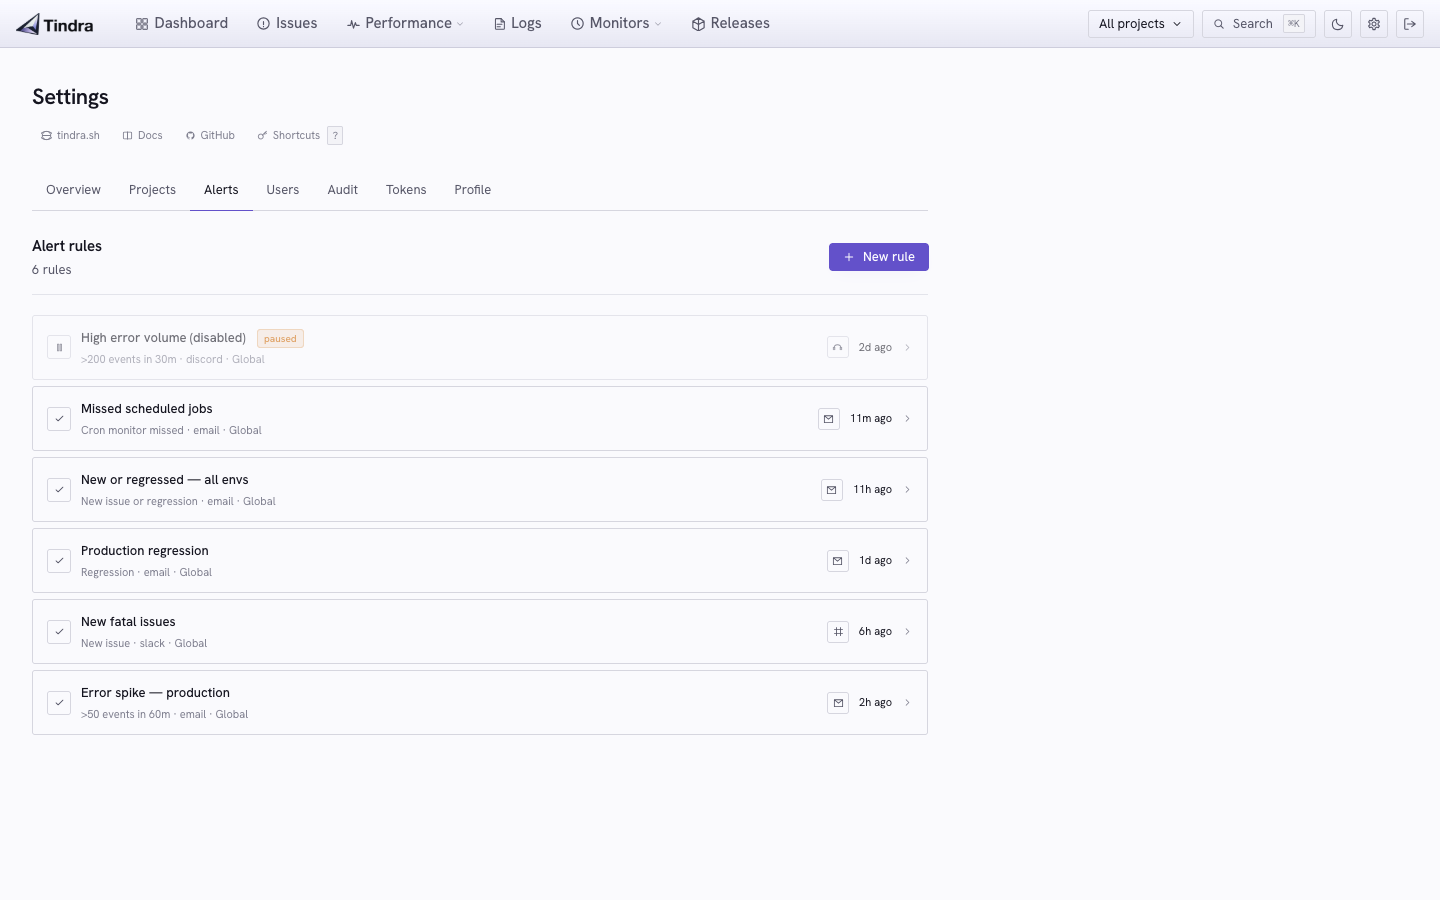
Go to Alerts and click New rule. Creating or changing rules requires manage_alerts. Older /settings/alerts links redirect to this page while preserving their query parameters and fragment.
Rule options
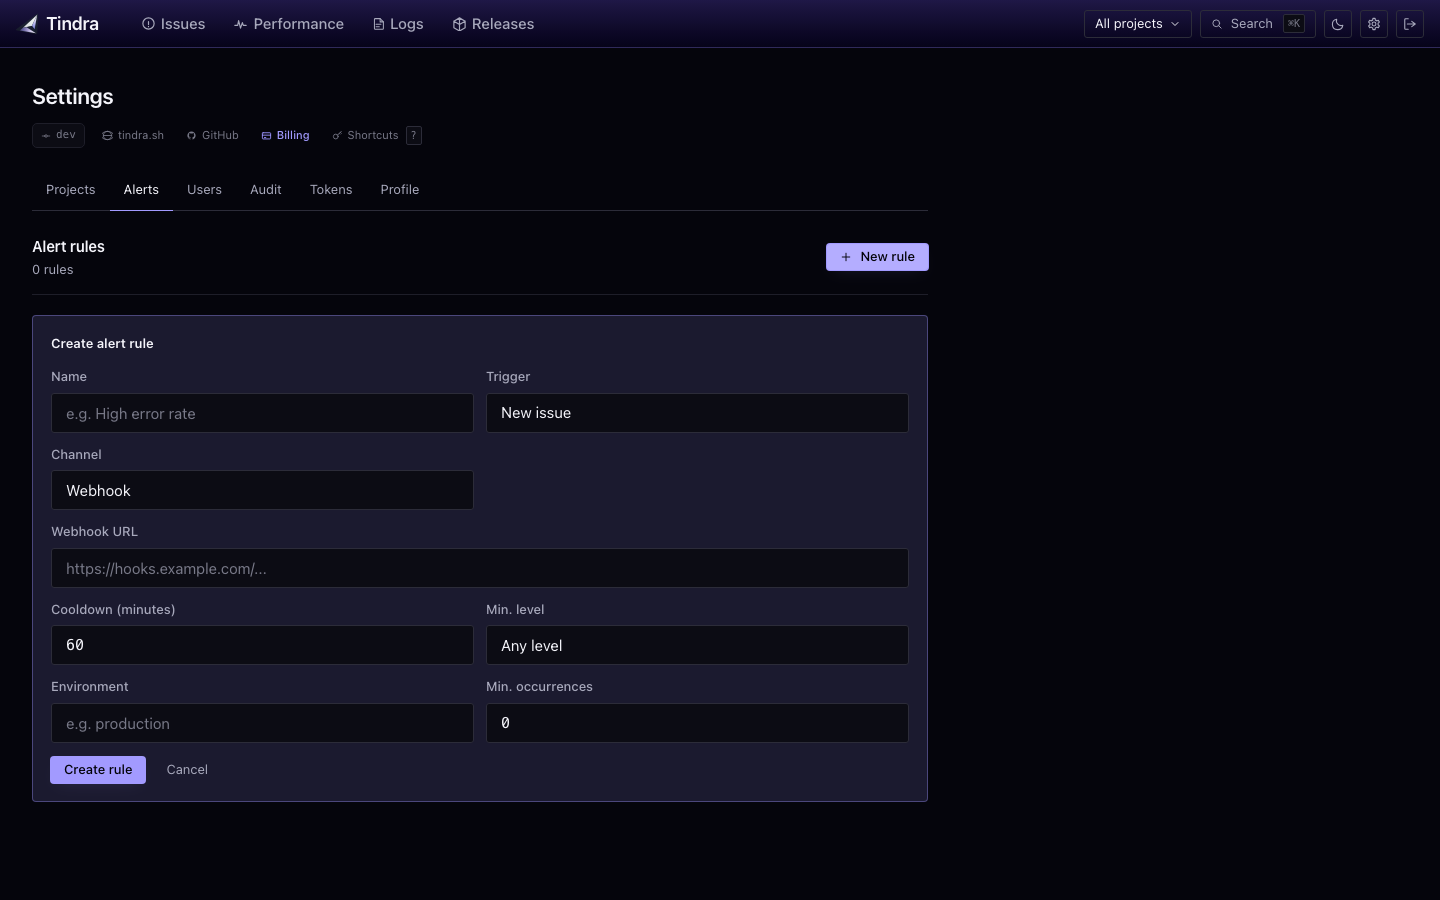
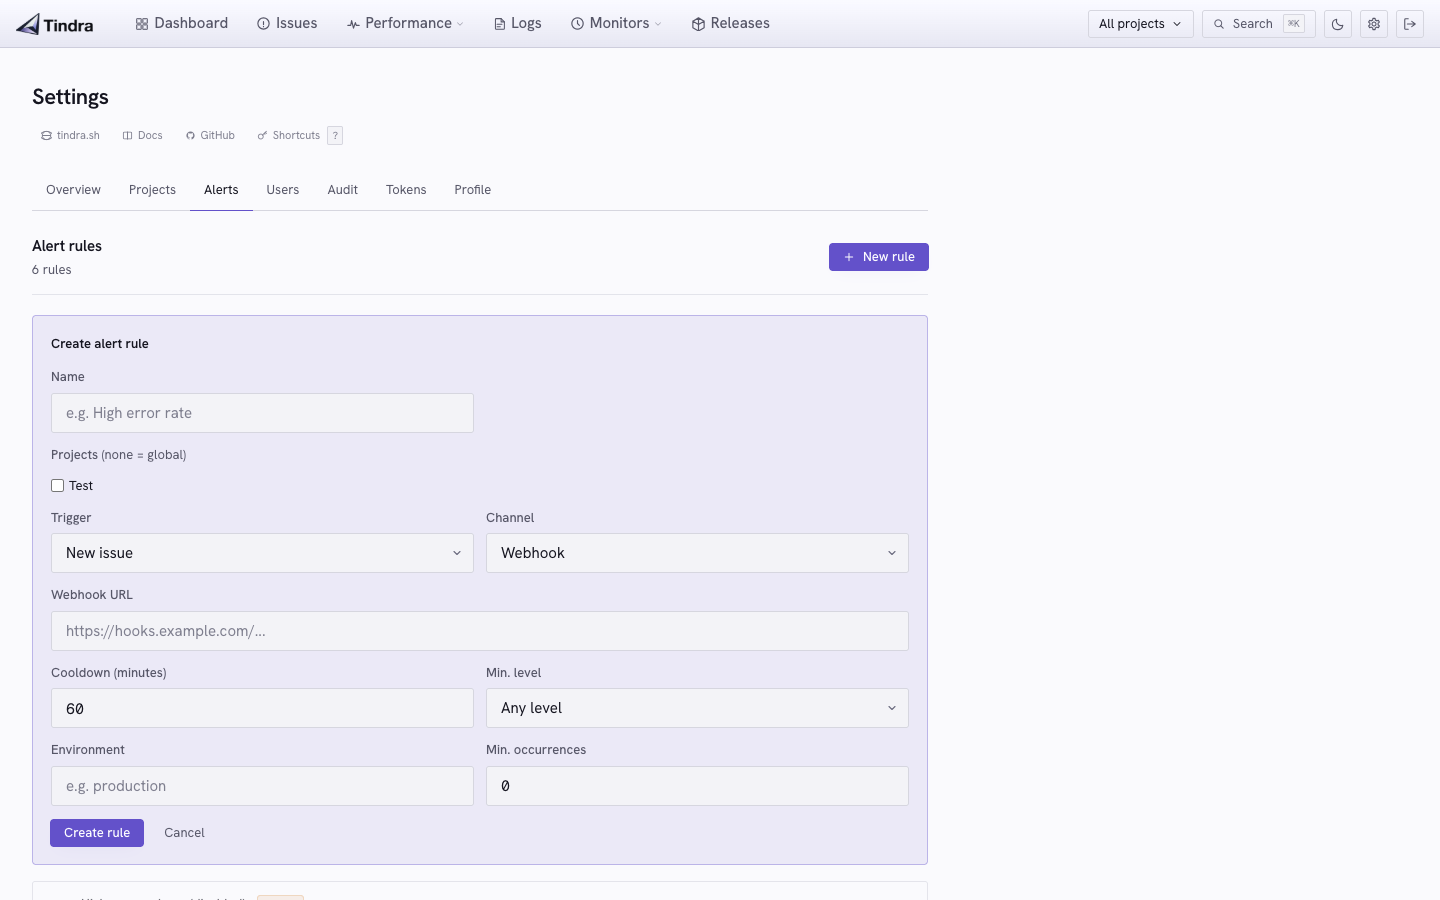
| Field | Description |
|---|---|
| Projects | Leave blank to watch all projects, or select one or more to scope the rule. Log count rules require at least one project. |
| Environment | Scope issue/event/log conditions to an environment, or leave blank for all. Monitor triggers do not apply this filter. |
| Trigger | The condition (see below) |
| Threshold | The count that fires the alert (event count and log count rules) |
| Window | Rolling window in minutes (event count and log count rules). Log count windows max out at 60 minutes. |
| Cooldown | Minutes to wait before the same rule can fire again. Default: 60. |
| Min. level | Lowest severity to include. Required for log count. |
| Search | Log body match. Required when a log count rule's min level is warning. |
| Action | Email, Slack, Discord, Microsoft Teams, or webhook |
Conditions
| Condition | What it checks |
|---|---|
| New issue | A brand new issue fingerprint is seen |
| Regression | A resolved issue re-opens |
| New issue or regression | Either of the two above |
| Event count above threshold | Total events received in the window reach or exceed the threshold |
| Log count above threshold | Matching log entries in the window reach or exceed the threshold |
| Cron monitor missed check-in | A cron monitor did not check in within its grace period |
| Cron monitor check-in error | A cron monitor completed with an error, including a correlated SDK check-in |
| Uptime monitor went down | An HTTP monitor transitioned to down |
| Uptime monitor recovered | A previously down HTTP monitor came back up |
Global rules
Leaving Projects blank creates a global rule that watches every project. Useful for a single "anything new in production" rule covering all your apps at once.
Log count rules cannot be global. Pick at least one project.
Log count alerts
Use a log count rule when a specific log line (or a severity) shows up too often. Typical case: payment errors, auth failures, or a noisy warning you actually care about.
| Constraint | Why it's there |
|---|---|
| At least one project | The count query is scoped. Blank/global is rejected. |
| Window 1–60 minutes | Keeps the count query bounded. |
| Min level is fatal, error, or warning | Info and debug firehoses are not alertable. |
| Search required at warning | Warning without a message match is just "the app is running." |
From the log viewer, click Alert on this to copy the selected projects, environment, level, and message search into a new rule. The button stays disabled until the level is Error or Fatal, or Warning plus a search. It requires permission to manage alerts.
The selected application user and fixed investigation interval are not copied. The rule uses its own rolling window and minimum severity, even when the log viewer was matching an exact level. Selecting all projects expands to the existing project IDs; future projects are not automatically included.
Search is a case-insensitive literal substring of the message body, not a search over attributes. warn and warning are accepted severity aliases. Log windows use SDK event timestamps, allowing up to two minutes of future clock skew, while event-count rules use receipt time.
Preview and threshold behavior
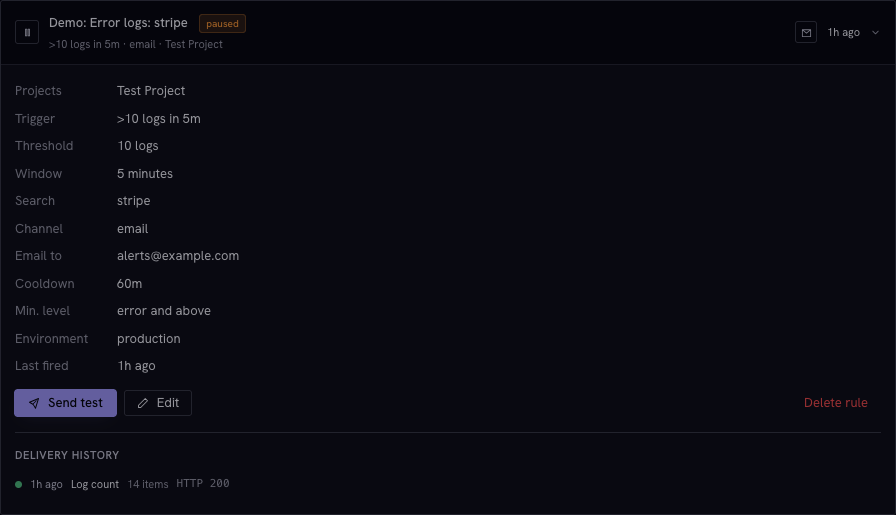
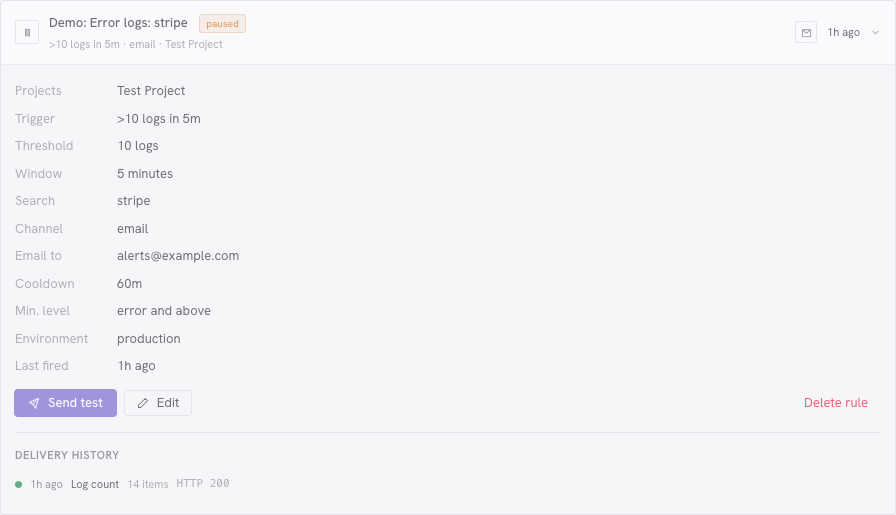
The log rule form previews matching entries in the configured rolling window and indicates when the count already meets the threshold. A threshold of 10 fires at 10 or more matches, subject to rule evaluation and cooldown. Rules are evaluated every 15 seconds, so “would fire immediately” in the preview is not a promise of synchronous delivery.
The preview is a snapshot. New arrivals and elapsed time can change the count before evaluation. Delivery enrichment includes up to five sample logs; if its full-count query fails, details.log_count can retain the threshold as a lower bound rather than an exact total.
Email alerts
Enter one or more email addresses in the alert action. Tindra sends a plain-text email with a link to the issue or issues that triggered the alert.
Email requires an EMAIL_PROVIDER to be configured on your instance. See Configuration.
Slack alerts
Select Slack as the action type and paste an incoming webhook URL. You can create one in your Slack workspace under Apps > Incoming Webhooks.
Tindra sends a formatted message with the rule name, trigger, project, and a direct link to the issue.
Discord alerts
Select Discord as the action type and paste an incoming webhook URL. You can create one in Discord under Channel Settings > Integrations > Webhooks.
Tindra sends a formatted message with the rule name, trigger, project, and a direct link to the issue.
Microsoft Teams alerts
Select Microsoft Teams as the action type and paste an incoming webhook URL created for your destination. For new integrations, follow Microsoft's incoming webhook workflow instructions.
Tindra sends an Adaptive Card with the alert title, project, trigger, and links to affected issues or monitor details.
Webhook alerts
Enter a URL and Tindra will POST a JSON payload when the rule fires. This example abbreviates the issue records:
{
  "rule_id": "550e8400-e29b-41d4-a716-446655440000",
  "rule_name": "High error rate on /api/orders",
  "project_id": "proj_abc123",
  "project_name": "my-app",
  "trigger": "event_count",
  "fired_at": "2024-11-15T14:32:00Z",
  "details": {
    "event_count": 47,
    "threshold": 20,
    "window_mins": 15
  },
  "issues": [
    { "id": "iss_xyz", "title": "TypeError: Cannot read 'id' of null", "level": "error" }
  ]
}
The trigger field is one of: new_issue, regressed, new_or_regressed, event_count, log_count, cron_missed, cron_error, uptime_down, uptime_recovered.
Log count payloads put the match in details and include up to five sample log rows:
{
  "trigger": "log_count",
  "details": {
    "log_count": 18,
    "threshold": 10,
    "window_mins": 5,
    "filter_level": "error",
    "filter_search": "stripe",
    "project_ids": ["proj_abc123"]
  },
  "logs": [
    { "id": "log_1", "level": "error", "body": "stripe charge failed", "timestamp": "2024-11-15T14:31:02Z" }
  ]
}
Uptime payloads include up to five monitors in uptime_monitors. Cron payloads use monitors.
Failed deliveries have up to three attempts: the initial attempt, a retry two minutes after its failure, and a final retry ten minutes after the second failure. Scheduling can add a short delay. After the final failure, the firing is marked failed. Expand a rule in Alerts to inspect its delivery history.
Private webhook destinations
Webhook-based channels accept HTTP(S) destinations. By default, private, loopback, link-local, and unspecified addresses are blocked. Destinations are checked when resolved for the connection, including redirect targets, so a public URL that redirects to an internal address can fail delivery.
For intentional internal delivery, a self-hosting operator can set WEBHOOK_ALLOW_PRIVATE_IPS=true. This also affects passthrough delivery, but not uptime probes or source-enrichment fetching. UPTIME_ALLOW_PRIVATE_IPS is a separate opt-in. Check the delivery error and resolved destination if a webhook unexpectedly fails.
Delivery history
Every firing is logged on the rule: time, trigger, item count, status, HTTP status code, and any error. Pending rows show retry N/3. Use this when you are not sure whether Slack actually got the message.
Creating rules via the MCP server
Alert rules can also be created programmatically using the create_alert_rule MCP tool. This requires a writable API token. See MCP Server for setup and API Tokens for token configuration.
Alert fatigue
Start with a high threshold and a real cooldown. An alert that fires every five minutes stops getting read. A weekly digest of persistent issues is often more actionable than a constant stream of individual notifications.
Good defaults to start with:
- Event count of at least 50 in 15 minutes for production
- New issue in production (immediately)
- Issue regression (immediately)
- Log count of
errormatching a specific string, 10 in 5 minutes