Transactions
A transaction is a single traced operation from start to finish. Click any transaction in the performance list to see the full span waterfall.
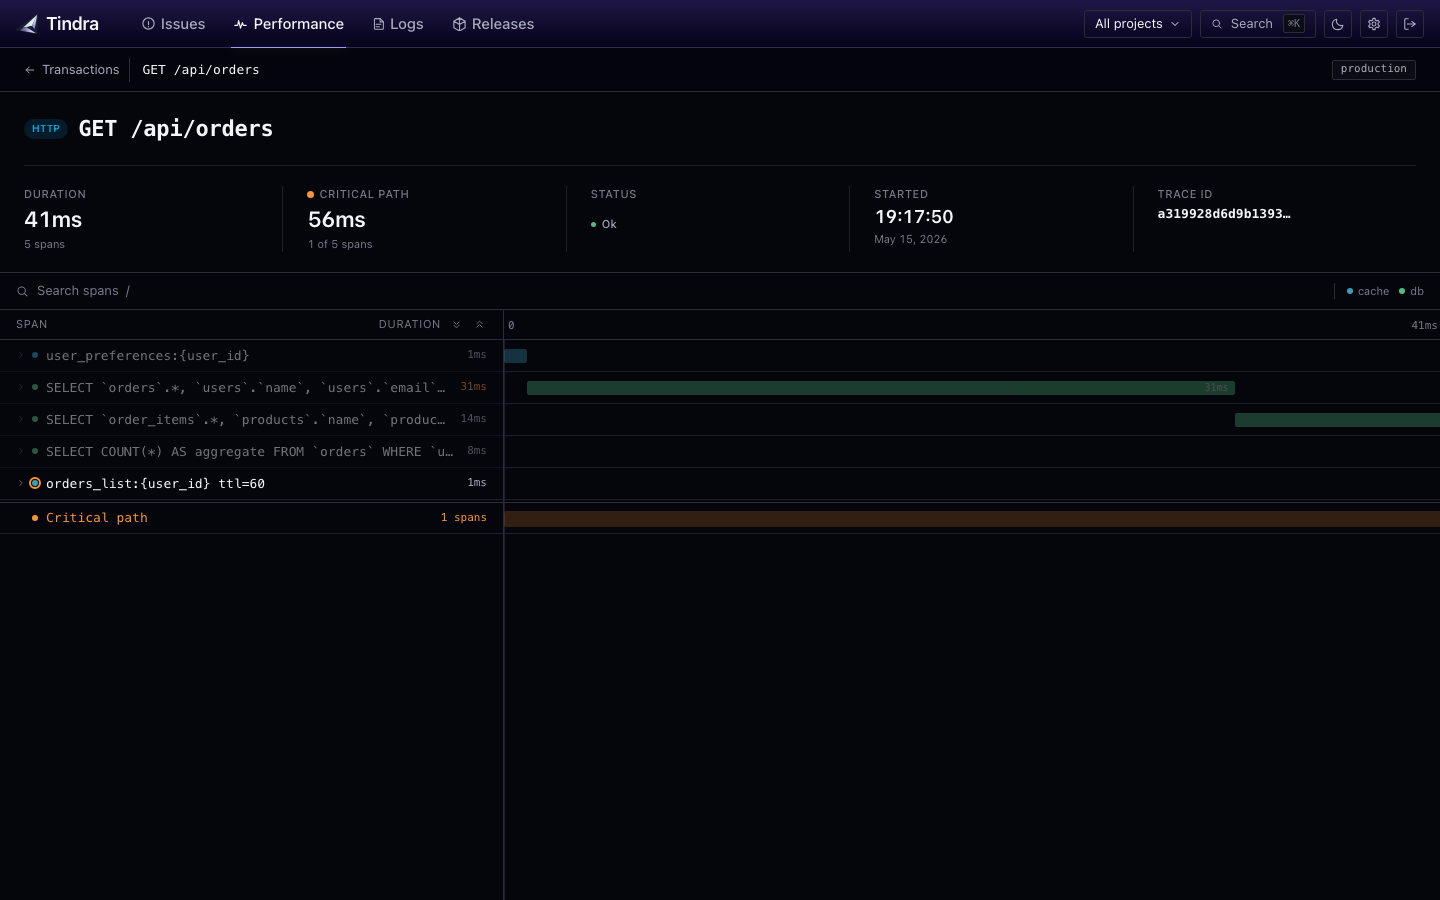
The span waterfall
Each row in the waterfall is a span. A timed unit of work within the transaction. Spans are nested to show the call hierarchy.
Common span types captured automatically:
| Op | What it tracks |
|---|---|
db.query |
Database queries |
cache.get / cache.set |
Cache operations |
http.client |
Outbound HTTP requests |
queue.publish |
Dispatching a queue job |
view.render |
Template rendering |
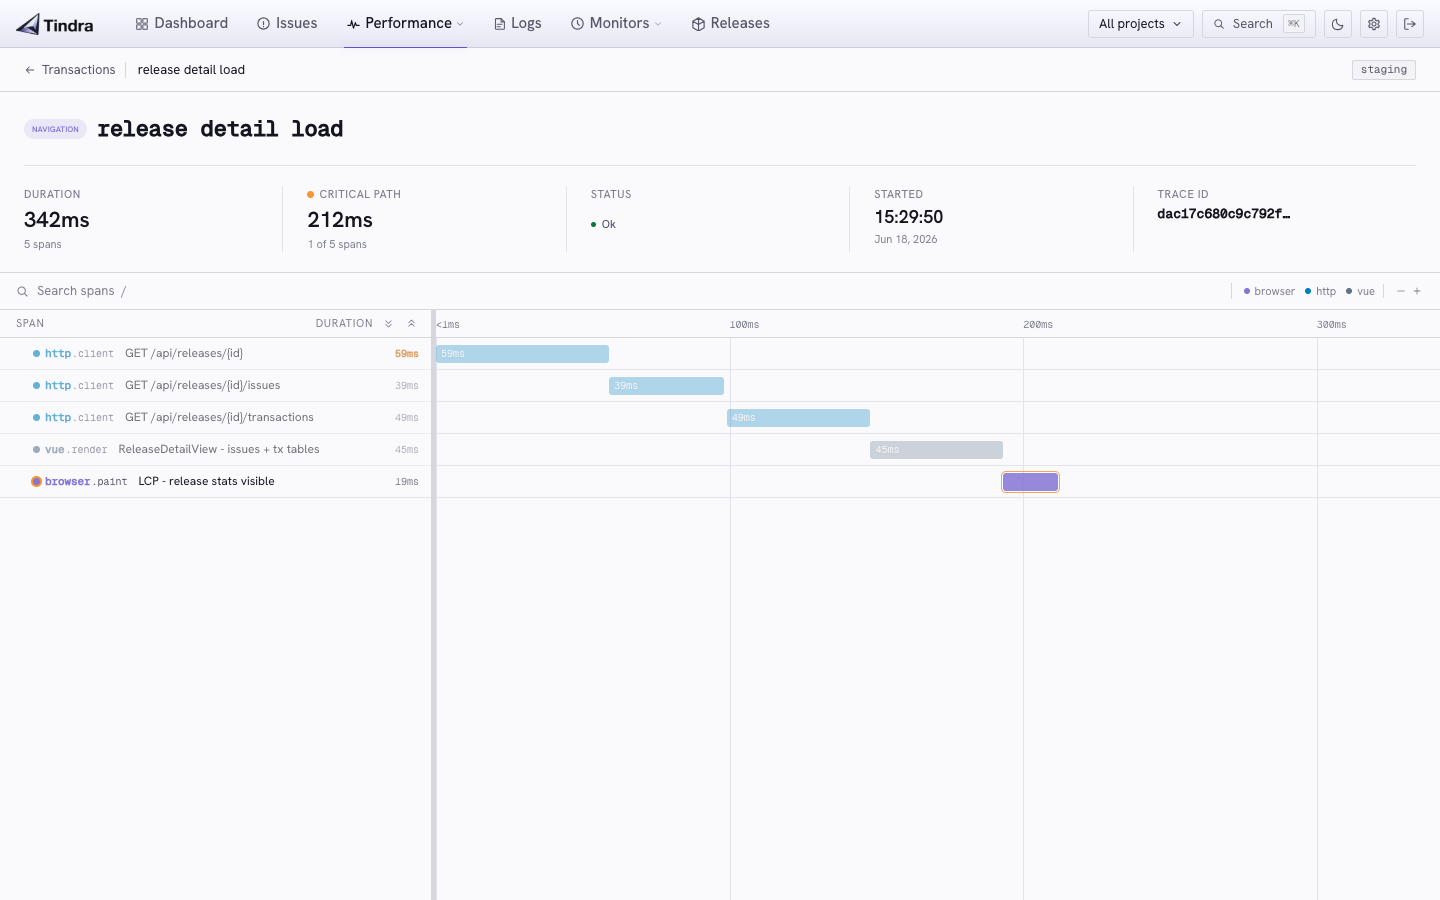
The width of each bar is proportional to duration. Spans that appear late in the waterfall may be waiting on an earlier span to complete.
Critical path
Spans on the critical path are highlighted in amber. Everything else dims to 30-45% opacity. The critical path summary at the bottom shows the total number of critical spans and their cumulative duration.
A span is on the critical path if removing it would make the overall transaction faster. Focus your optimization effort there.
Reading the waterfall
Look for:
- Amber spans (critical path): these directly determine the transaction duration
- Wide spans: operations that take the most wall-clock time
- Long tail on a single span: could be a missing index or a slow external service
Custom spans
Add spans for your own code to get full visibility.
PHP / Laravel
$span = \Sentry\startSpan(
    \Sentry\Tracing\SpanContext::fromTraceparent(
        \Sentry\getTraceparent()
    )
);
$span->setOp('export.csv');
$span->setDescription('Generate monthly report CSV');

// ... your work

$span->finish();
Or use the higher-level helper:
\Sentry\trace(function () use ($data) {
    return generateCsvExport($data);
}, 'export.csv', 'Generate monthly report CSV');
JavaScript
const span = Sentry.startSpan({ op: 'process', name: 'Parse upload' }, () => {
  return parseUploadedFile(file);
});
Python
with sentry_sdk.start_span(op="process", description="Parse upload"):
    parse_uploaded_file(file)
Transaction tags
Transactions carry the same environment and release tags as error events. Use them to filter the performance list to a specific release or environment.
Linking errors to transactions
When an error is captured during a transaction, Tindra links them. From the issue detail page, click View trace to jump to the transaction that was in flight when the error occurred.