Performance Overview
Tindra captures transaction traces from your application so you can find slow endpoints, identify database bottlenecks, and understand where time is spent.
What is a transaction?
A transaction is a timed operation with a name, usually an HTTP request or a background job. Transactions contain spans. Individual timed segments within the operation, like database queries, cache lookups, or external HTTP calls.
GET /api/orders (245ms)
  ├── db SELECT orders (180ms)
  ├── cache.get session (1ms)
  └── http POST analytics (18ms)
Enabling performance monitoring
Set a sample rate in your SDK to start capturing transactions. A rate of 0.1 captures 10% of all requests.
Laravel
SENTRY_TRACES_SAMPLE_RATE=0.1
JavaScript
Sentry.init({
  dsn: '...',
  tracesSampleRate: 0.1,
});
Python
sentry_sdk.init(
    dsn="...",
    traces_sample_rate=0.1,
)
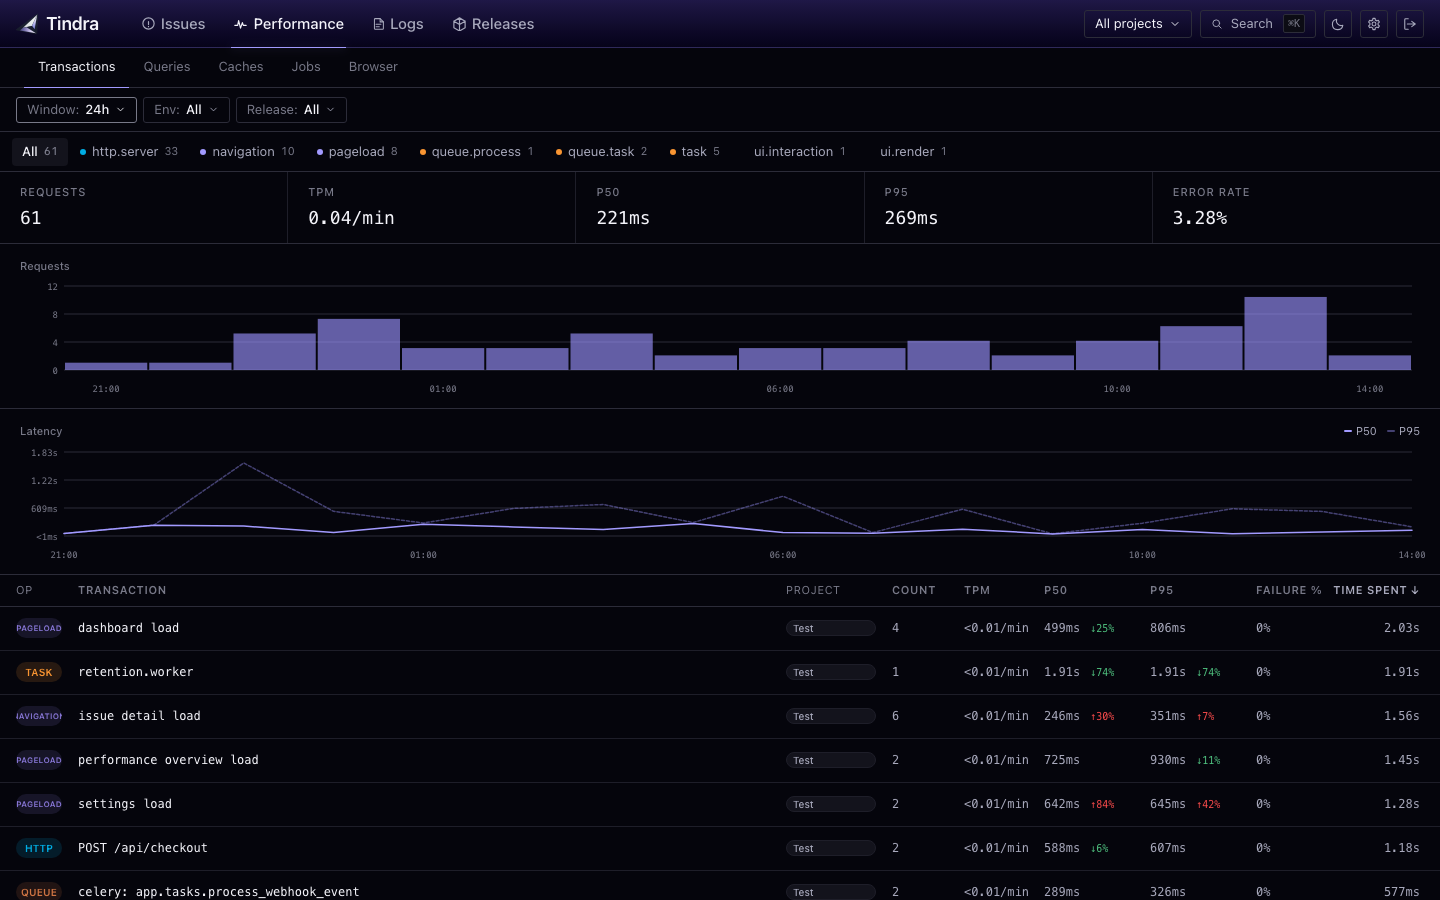
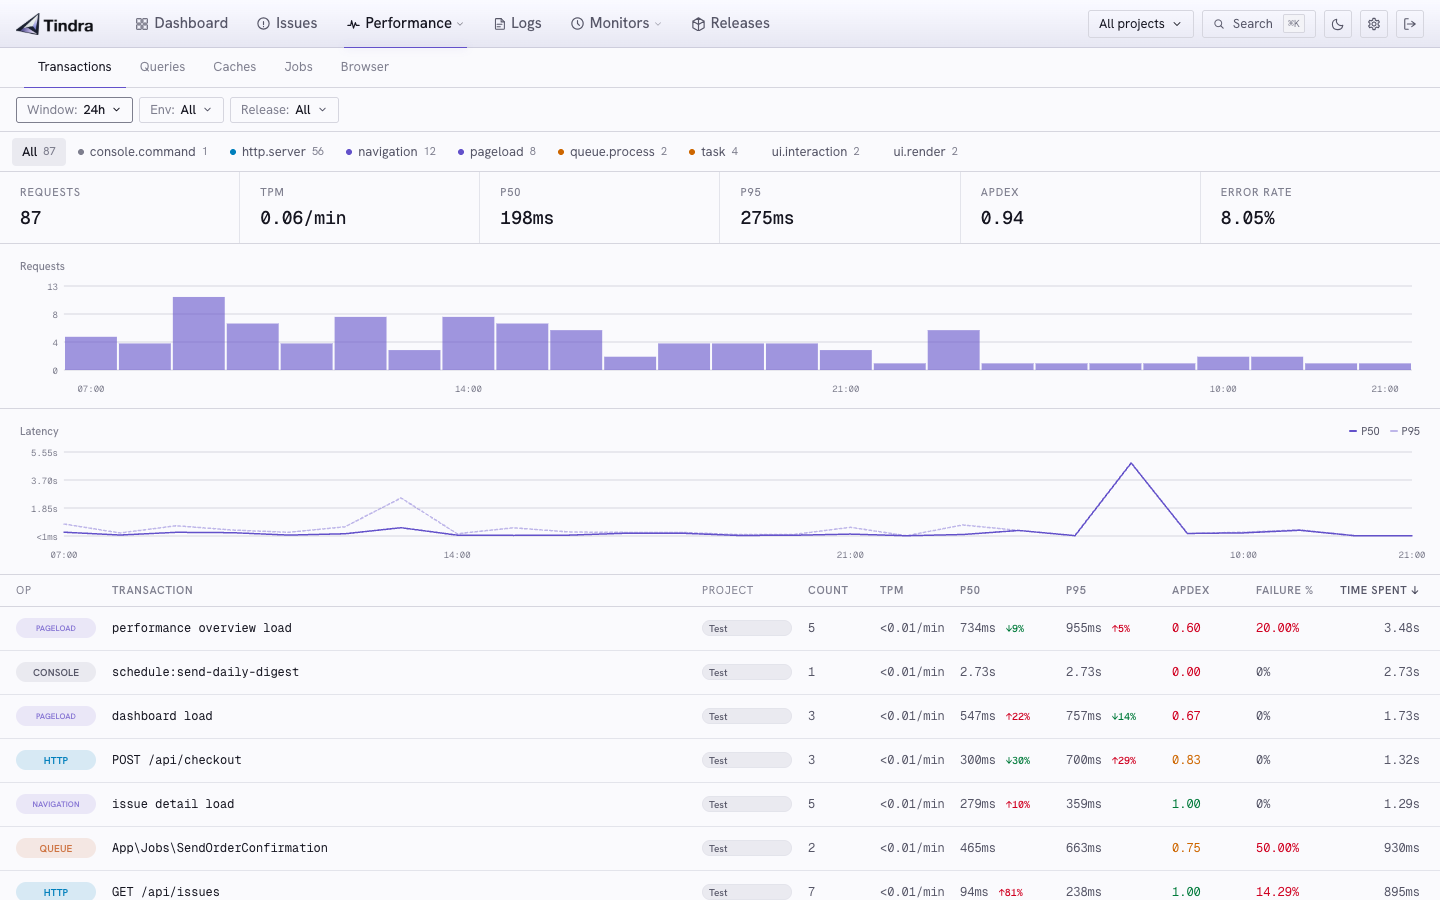
The transactions list
Navigate to Performance in the sidebar to see all captured transactions grouped by name. For each transaction you see:
- P50 / P95 / P99 latency: median and tail latencies
- Throughput: requests per minute
- Error rate: percentage of transactions that ended with an error
Sort by P95 or throughput to find your slowest or busiest endpoints.
Sampling strategy
Start with a low sample rate (0.05–0.1) and increase it if you need more granularity on specific endpoints. High-traffic applications rarely need 100% sampling.
For background jobs you may want full sampling since they run less frequently:
// Capture all queue jobs, sample 10% of HTTP requests
'traces_sampler' => function (\Sentry\Tracing\SamplingContext $context): float {
    if ($context->getTransactionContext()->getOp() === 'queue.process') {
        return 1.0;
    }
    return 0.1;
},
Next steps
- Transactions: drilling into individual traces
- Web Vitals: Core Web Vitals for frontend pages