Uptime Monitors
Uptime monitors probe HTTP and HTTPS endpoints on a regular schedule and alert you when something goes down or recovers.
How it works
Tindra probes each active monitor every 30 seconds. A monitor goes down after 2 consecutive failures and comes back up on the first successful probe. The transition triggers the corresponding alert rule if one is configured.
Uptime checks do not count toward your monthly event quota.
Creating a monitor
Go to Monitors > Uptime and click New monitor. Configure:
| Field | Description |
|---|---|
| Name | A label for the monitor, shown in the list and alert payloads |
| URL | The full HTTP or HTTPS URL to probe |
| Method | HEAD (default, low overhead) or GET (required for body checks) |
| Interval | How often to probe, in seconds |
| Timeout | How long to wait before marking the probe as failed |
| Expected status codes | Accepted codes or ranges, e.g. 200, 200-299, 200,301 |
| Body contains | Optional string that must appear in the response body (GET only) |
States
| State | Meaning |
|---|---|
unknown |
No probes have completed yet |
up |
Last probe succeeded |
down |
Two or more consecutive failures |
Alerting
Create an alert rule with trigger Uptime down to get notified when a monitor transitions to down. Use Uptime recovered to get notified when it comes back up.
Alert payloads include up to 5 affected monitors with their names and URLs. Alert rules are configured in Settings > Alerts and support email, Slack, Discord, and webhook channels.
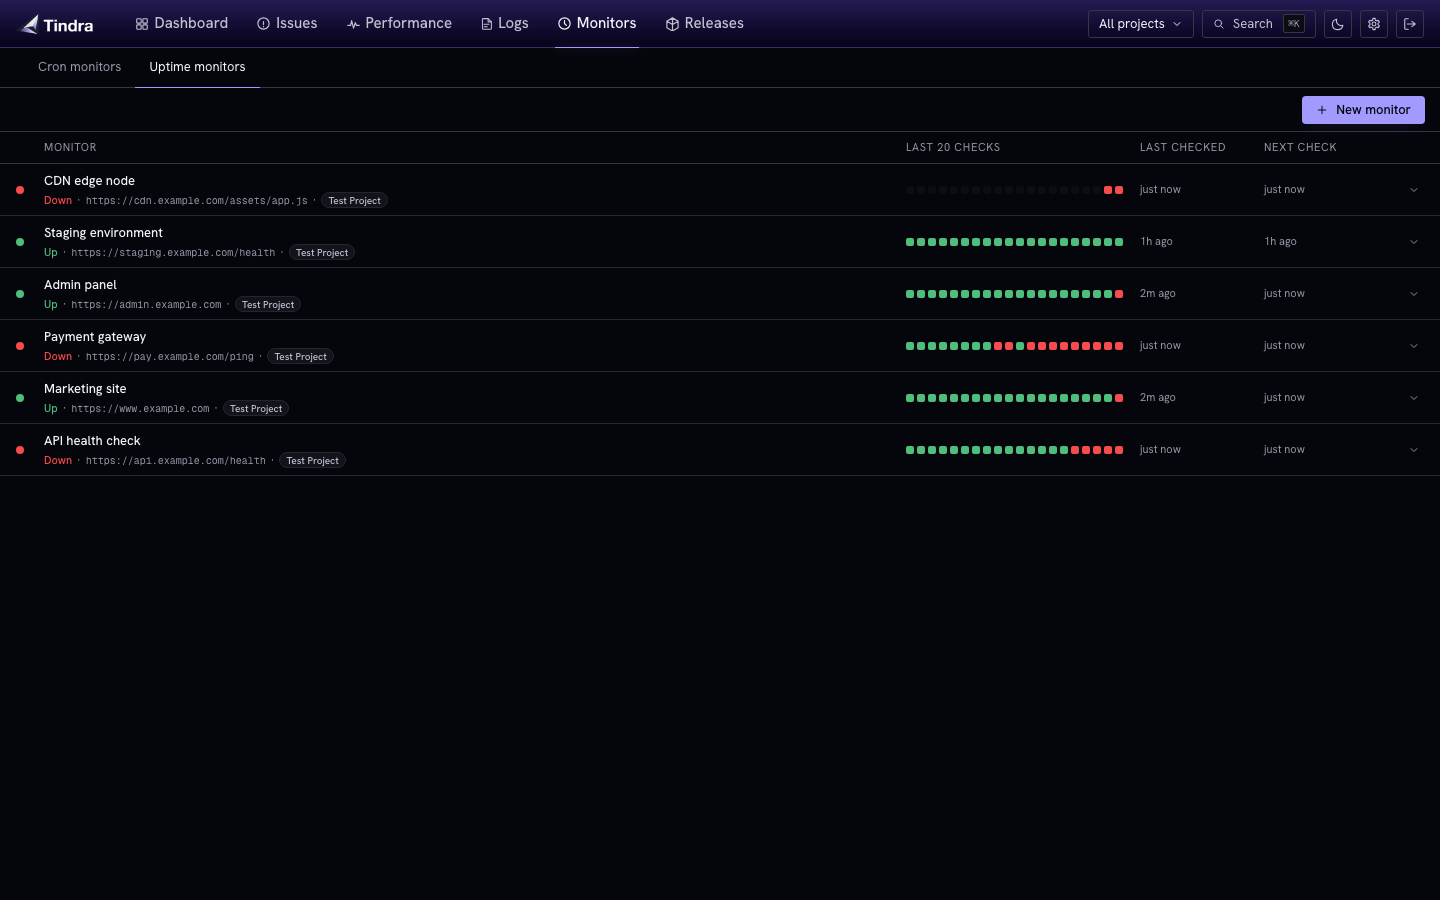
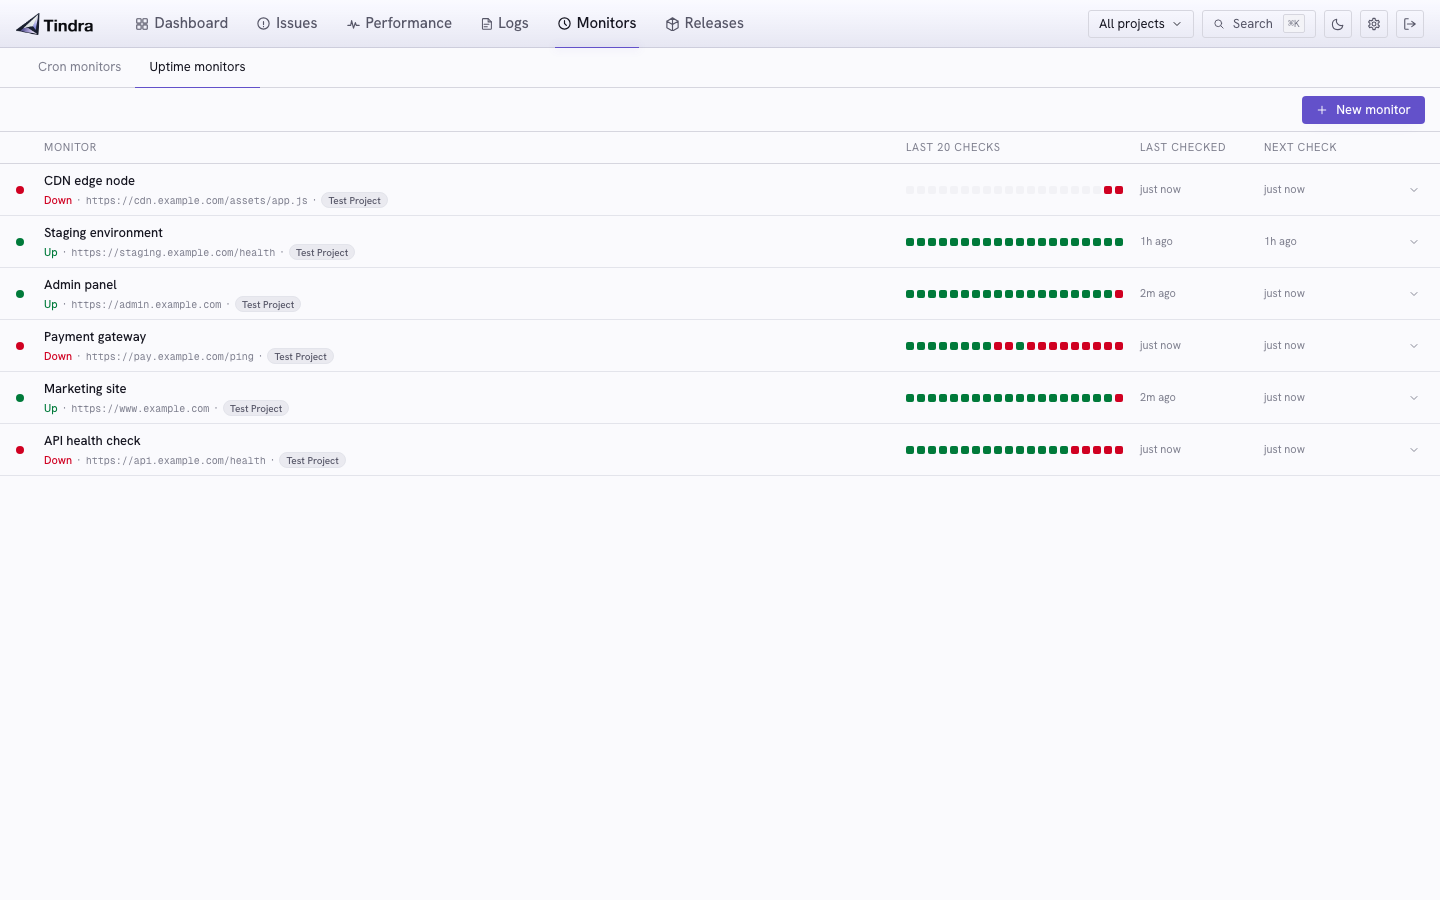
Check history
Each monitor shows its recent probe history in a timeline strip. Click a monitor to see the full check log with timestamps, HTTP status codes, response times, and any error messages.
Pausing a monitor
Pause a monitor from the monitor detail panel. Paused monitors are skipped by the probe worker and do not trigger alerts.