Error tracking,
performance monitoring,
uptime and cron monitoring.
Self-hosted or managed in the EU.

Follow a customer’s error into their logs and slow requests, with the same context throughout. Run one binary and Postgres yourself, or choose a dedicated instance in the EU.

v1.0.3 Released Release notes
14 days free No credit card
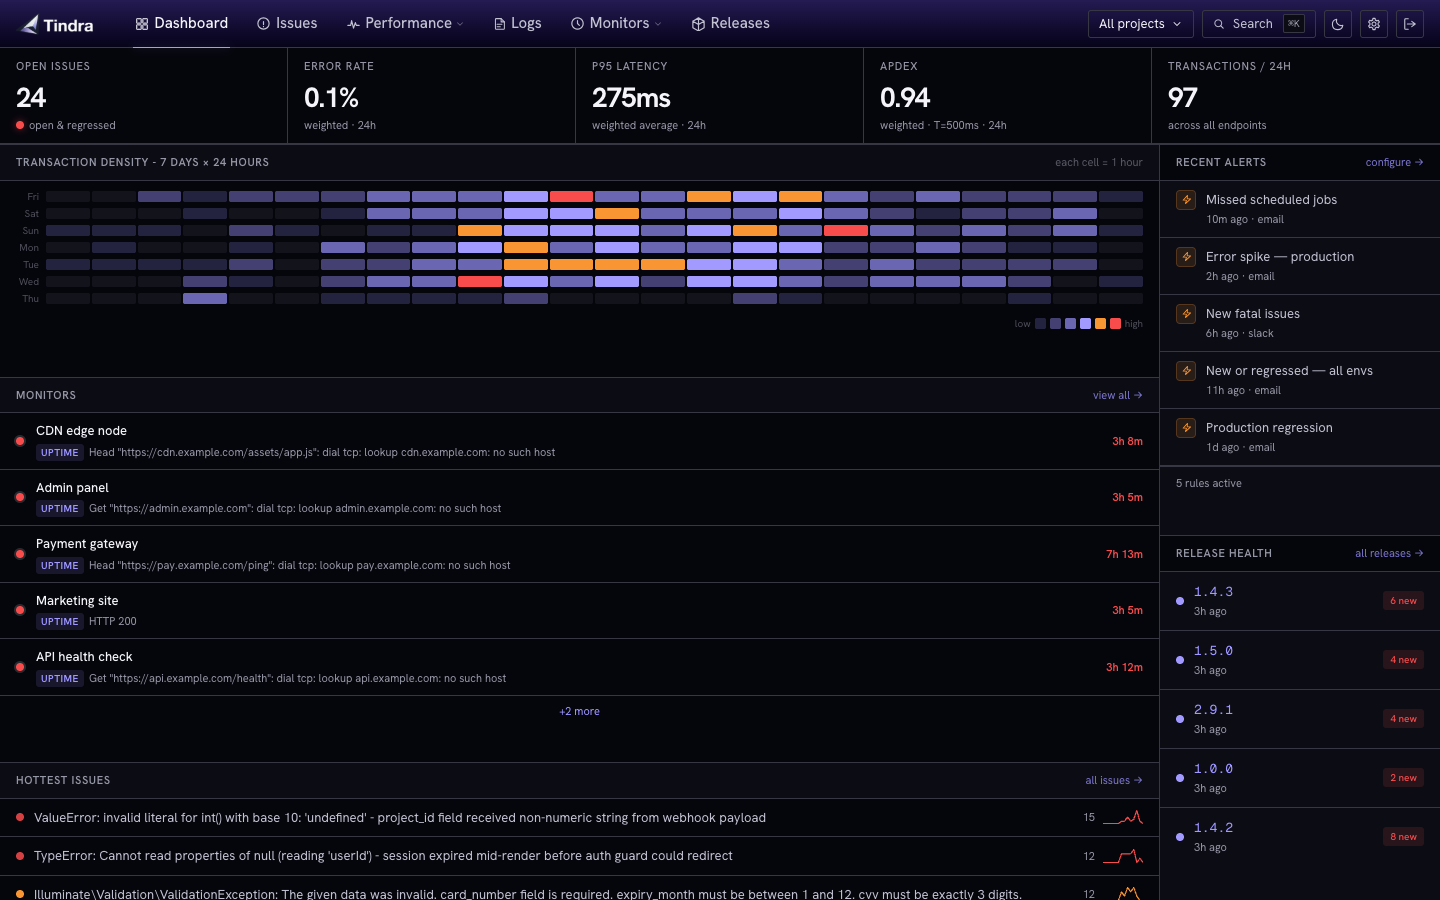
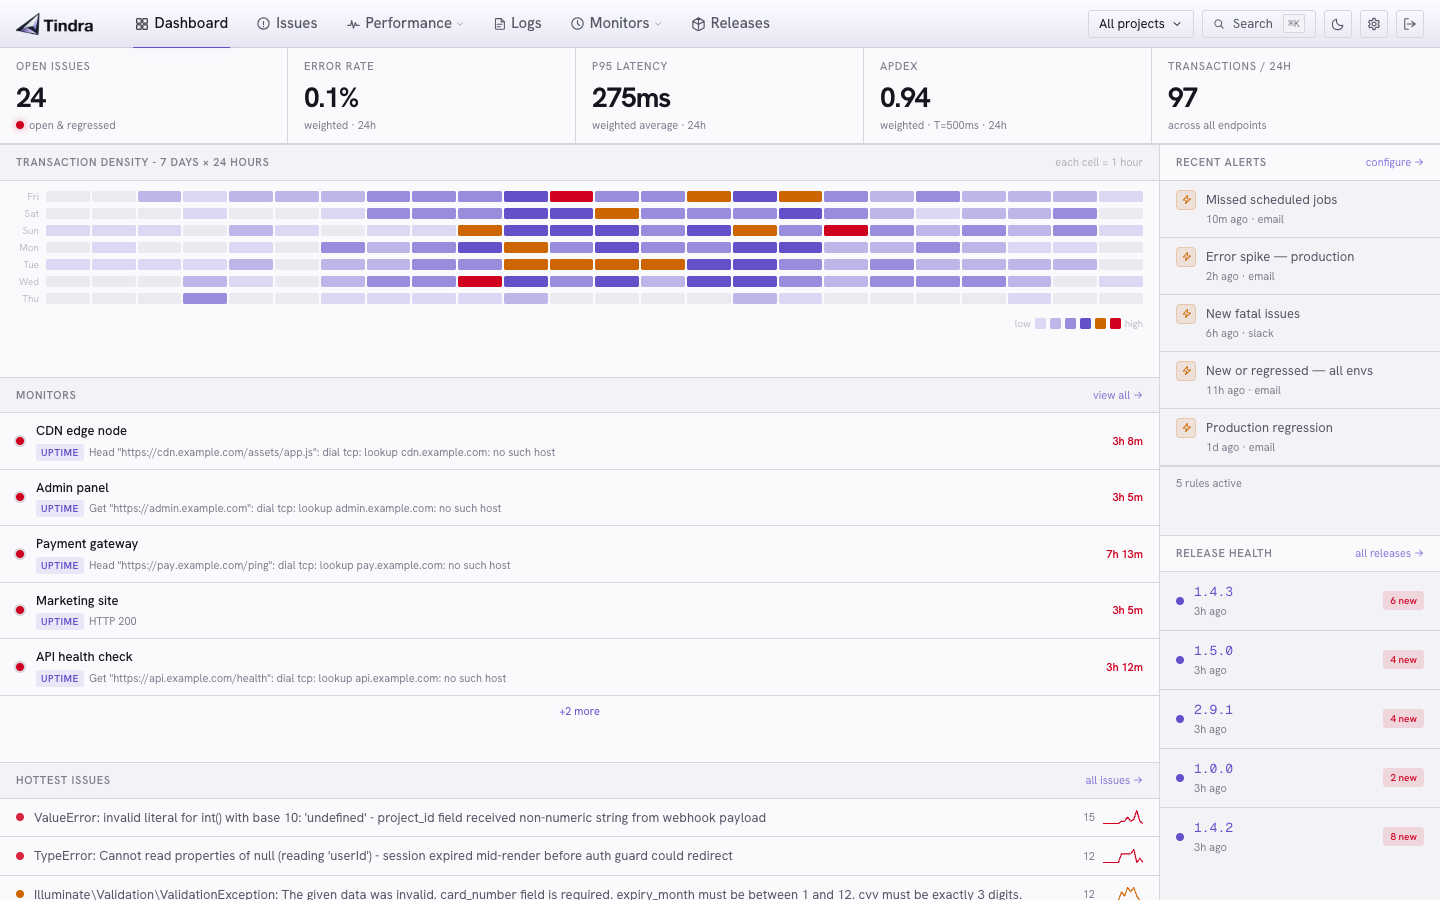
Tindra dashboard Tindra dashboard
Built and maintained by Blendbyte GmbH EU-hosted · data never leaves the EU GDPR · DPA available We use Tindra in production

From the first error to the request that explains it.

Tindra brings errors, structured logs, traces, and profiles together for small and medium teams. Keep the same user, project, environment, and time range while you investigate, then check your monitors and alert history for the wider picture. A guided setup helps you confirm that your app is sending data before you need it.

Customer investigation with Jane Doe’s issues and shared filters Customer investigation with Jane Doe’s issues and shared filters

Follow the person behind the error

Choose an affected user and move from their issues to their logs, individual traces, and browser page loads. Your project, environment, and time filters follow along. See the investigation workflow.

users · shared filters · traces

Turn useful logs into useful alerts

Search structured log messages, inspect their attributes, and open a matching trace. Use Alert on this to turn a recurring error or focused warning search into a volume alert. See logs and alerts.

structured logs · search · volume alerts

Your own isolated instance

Every managed customer gets a dedicated container and a dedicated Postgres. Not a row in a shared table, not a schema-per-tenant trick. Your data lives in its own process.

isolation · dedicated postgres

Keep your familiar Sentry SDK

Keep your Sentry SDK and point it at your Tindra DSN. Guided checks confirm a stored test event, while source-map verification checks real frames from your build. Get your app connected.

php · go · js · python · rust · jvm

Errors, performance, uptime, and cron jobs

Stack traces, span waterfalls, HTTP uptime probes, and cron monitor health under one roof. Find an error, jump to the slow span, check if your API is up, confirm the nightly job ran. Configurable alerts for all of it.

issues · transactions · uptime · cron · alerts

Flame graphs, down to the function

The waterfall tells you which query was slow. The flame graph tells you which function. Enable your SDK’s profiler to attach profiles to sampled work and inspect them on the transaction. Profiles never count as events.

profiling · flame graph · php · python · node · ruby

Hosted in the EU, full stop

Every byte we manage stays in the EU. No US fallback region. No replica in the wrong hemisphere because someone forgot a checkbox. Signed DPA available in two clicks.

eu-only · gdpr · dpa

Ask your AI assistant about your errors

Connect an MCP-compatible assistant to inspect stack frames, breadcrumbs, and older occurrences alongside traces and logs. Project-scoped tokens keep access focused, with writes enabled only when you choose.

mcp · ai-ready · mobile · api

One binary. One Postgres. Thirty seconds.

No Kafka, no ClickHouse cluster, no side-cars to keep alive at 03:00. Pull the Docker image, point it at a Postgres, and it is running. That is the whole install.

go · postgres · docker

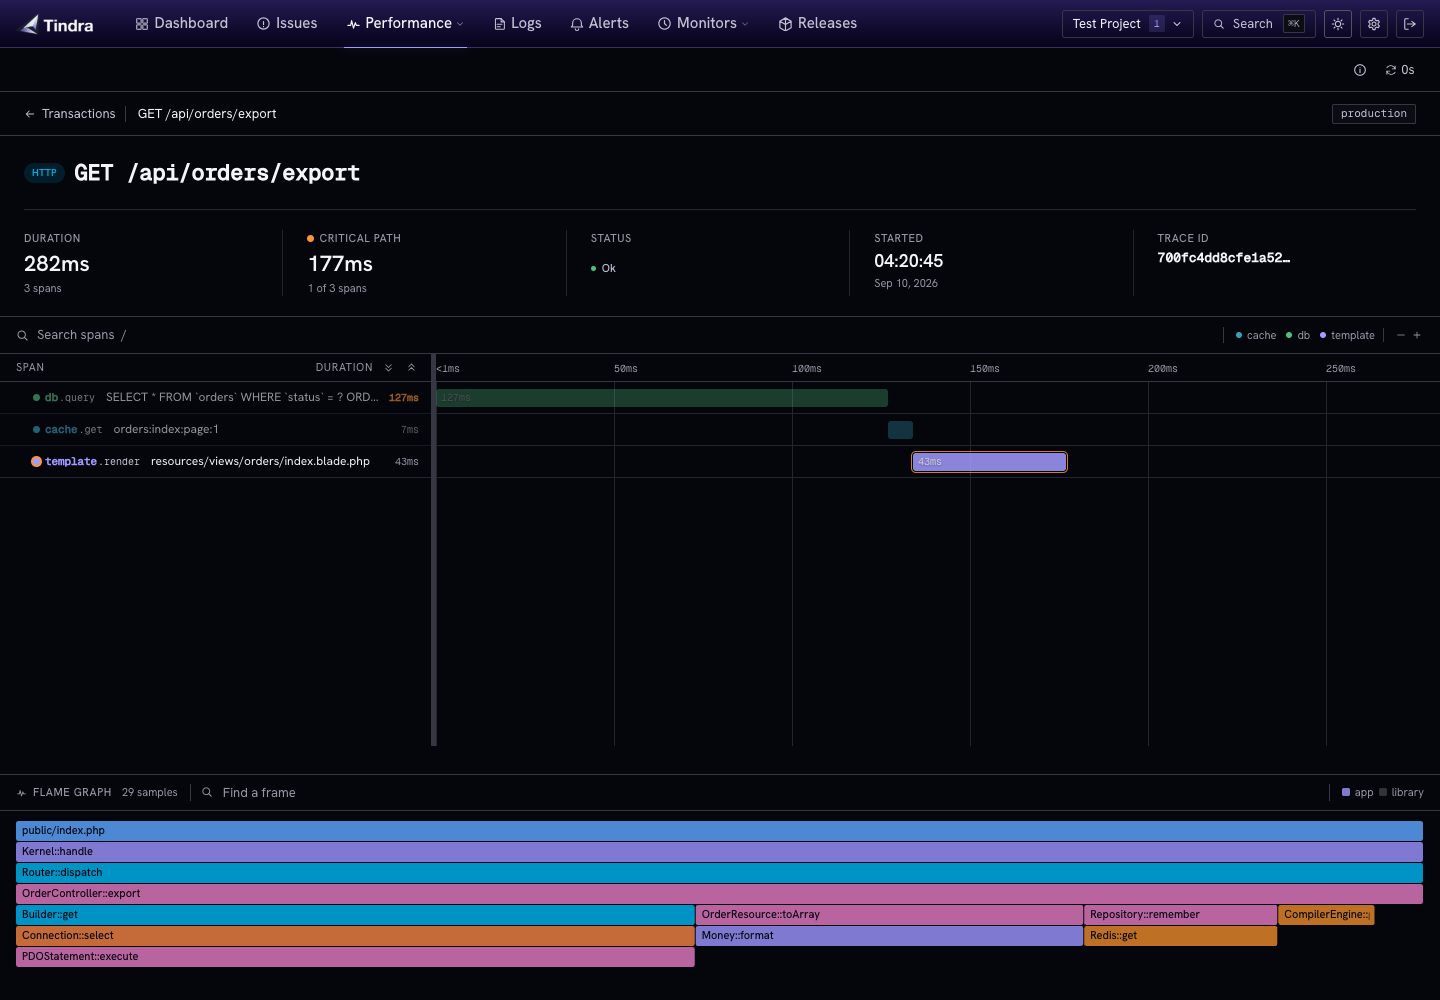
See exactly where time goes. Critical path highlighted, spans inline, flame graph underneath.

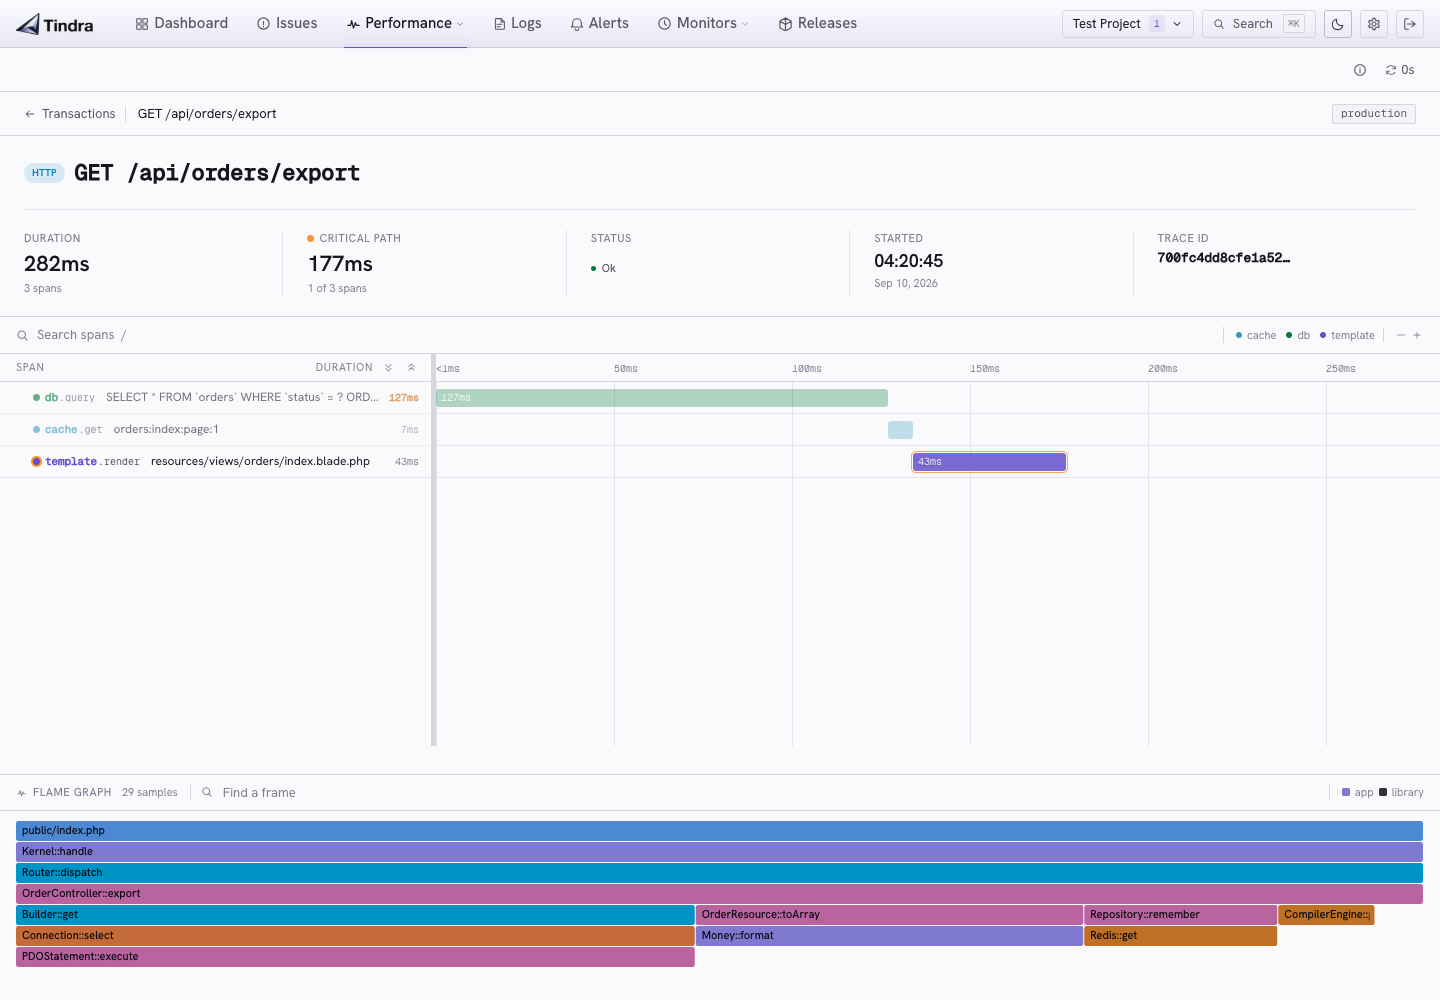
Transaction waterfall with a sampled flame graph Transaction waterfall with a sampled flame graph

Self-host the binary. Or let us run an isolated copy for you in the EU.

Same product, same UI, same SDK protocol. The only thing that changes is whose pager goes off at 3am.

self-hosted · free, source available

One command. Runs anywhere.

One Docker image. One Postgres. A handful of env vars. That is the entire install. No side-cars, no orchestration required.

$ bash -c "$(curl -sSL https://install.tindra.sh)"
  • Source available · Elastic License 2.0
  • No telemetry, no license server
  • GitHub Issues and Discussions for support
  • Same UI, same SDK protocol as managed
managed by blendbyte · from $9/mo

Or we run it for you, in the EU.

Sign up, pick a plan, and within a few minutes you have your own subdomain pointed at a freshly provisioned instance. Backups, upgrades, retention enforcement, and the pager are on us.

  • Dedicated container and Postgres per customer
  • Hosted in the EU, never replicated outside
  • Nightly encrypted backups, 14-day point-in-time recovery
  • OAuth/OIDC single sign-on
  • Signed DPA, GDPR Art. 28 compliant
  • 99.9% uptime SLA on Studio and Scale
Built & run in the EU

Your server data never leaves the EU. Not for backups. Not even by mistake.

Tindra Managed runs entirely within the EU. Backups replicate to a second availability zone in the same region. Object storage stays EU-only. No US sub-processors, ever.

Data residency
EU-only
Backup retention
14-day PITR
DPA
Art. 28 ready
Data deletion
Within 24h

Simple plans. One number to track. No surprise invoices.

Pick the plan that matches your event volume. If you hit the limit, events stop being recorded until the next cycle. Upgrade your plan if you need more. No surprise charges.

Hobby
$9 /mo

50,000 events / mo

30 days retention

  • 1 project
  • 3 user accounts
  • 500K logs · 1M transaction rows · 256 MB profiles
  • Email support
Start free trial
Indie popular
$39 /mo

500,000 events / mo

60 days retention

  • Unlimited projects
  • Unlimited users
  • 10M logs · 25M transaction rows · 1 GB profiles
  • Email support
Start free trial
Scale
$549 /mo

50,000,000 events / mo

90 days retention

  • Unlimited projects & users
  • 250M logs · 500M transaction rows · 8 GB profiles
  • SSO, OIDC, audit log
  • 99.9% uptime SLA
  • Dedicated account manager
Start free trial
Events = errors + transactions, combined. Logs, cron check-ins and profiles are free. · Log, transaction and profile storage limits are instance-wide totals; oldest entries deleted when full. · All plans: 14-day free trial, no credit card.

Everything you need. Cheaper to start. One container to self-host.

Tindra Sentry GlitchTip AppSignal
Performance monitoring ✓ ✓ ✓ ✓
Profiling / flame graphs ✓ ✓ – –
Log viewer ✓ ✓ – –
Uptime monitoring ✓ ✓ ✓ ✓
Cron monitoring ✓ ✓ ✓ ✓
MCP support ✓ ✓ * – –
Entry plan $9 / mo Free (1 user) / $29/mo Free (1K events) / $15/mo $23 / mo
Self-hosting One container, any box Free, ~65 containers by default, 16 GB RAM min Free, Django + Redis + Celery + Postgres Not available
EU data residency All plans Optional add-on Not available Yes (default)
At limit Events paused, no auto-billing Auto-billed per event Throttled, blocked at 2x quota No hard limits

* Sentry's MCP server is a separate hosted service (or a local process for self-hosted). Tindra's is built into the binary, no extra setup.

Verified July 2026

Set up in minutes. Self-hosted or managed.

Pick a plan and your instance is ready in minutes. Or pull the Docker image and you are running before your coffee is done.